> For the complete documentation index, see [llms.txt](https://docs.enlyze.com/llms.txt). Markdown versions of documentation pages are available by appending `.md` to page URLs; this page is available as [Markdown](https://docs.enlyze.com/en/getting-started/onboarding-guides/for-operators.md).

# For operators

What ENLYZE gives you as an operator and how to apply it.

As an operator, you use ENLYZE for three things. Jump straight to the case you're here for:

* [Keep an eye on production](#keep-an-eye-on-production): see which machine is running, how the current production run is tracking, and where something needs attention.
* [Contextualize downtimes](#contextualize-downtimes): give detected downtimes their reason.
* [Produce products to spec](#produce-products-to-spec): use the Co-Pilot to check the machine is running in spec.

## Keep an eye on production

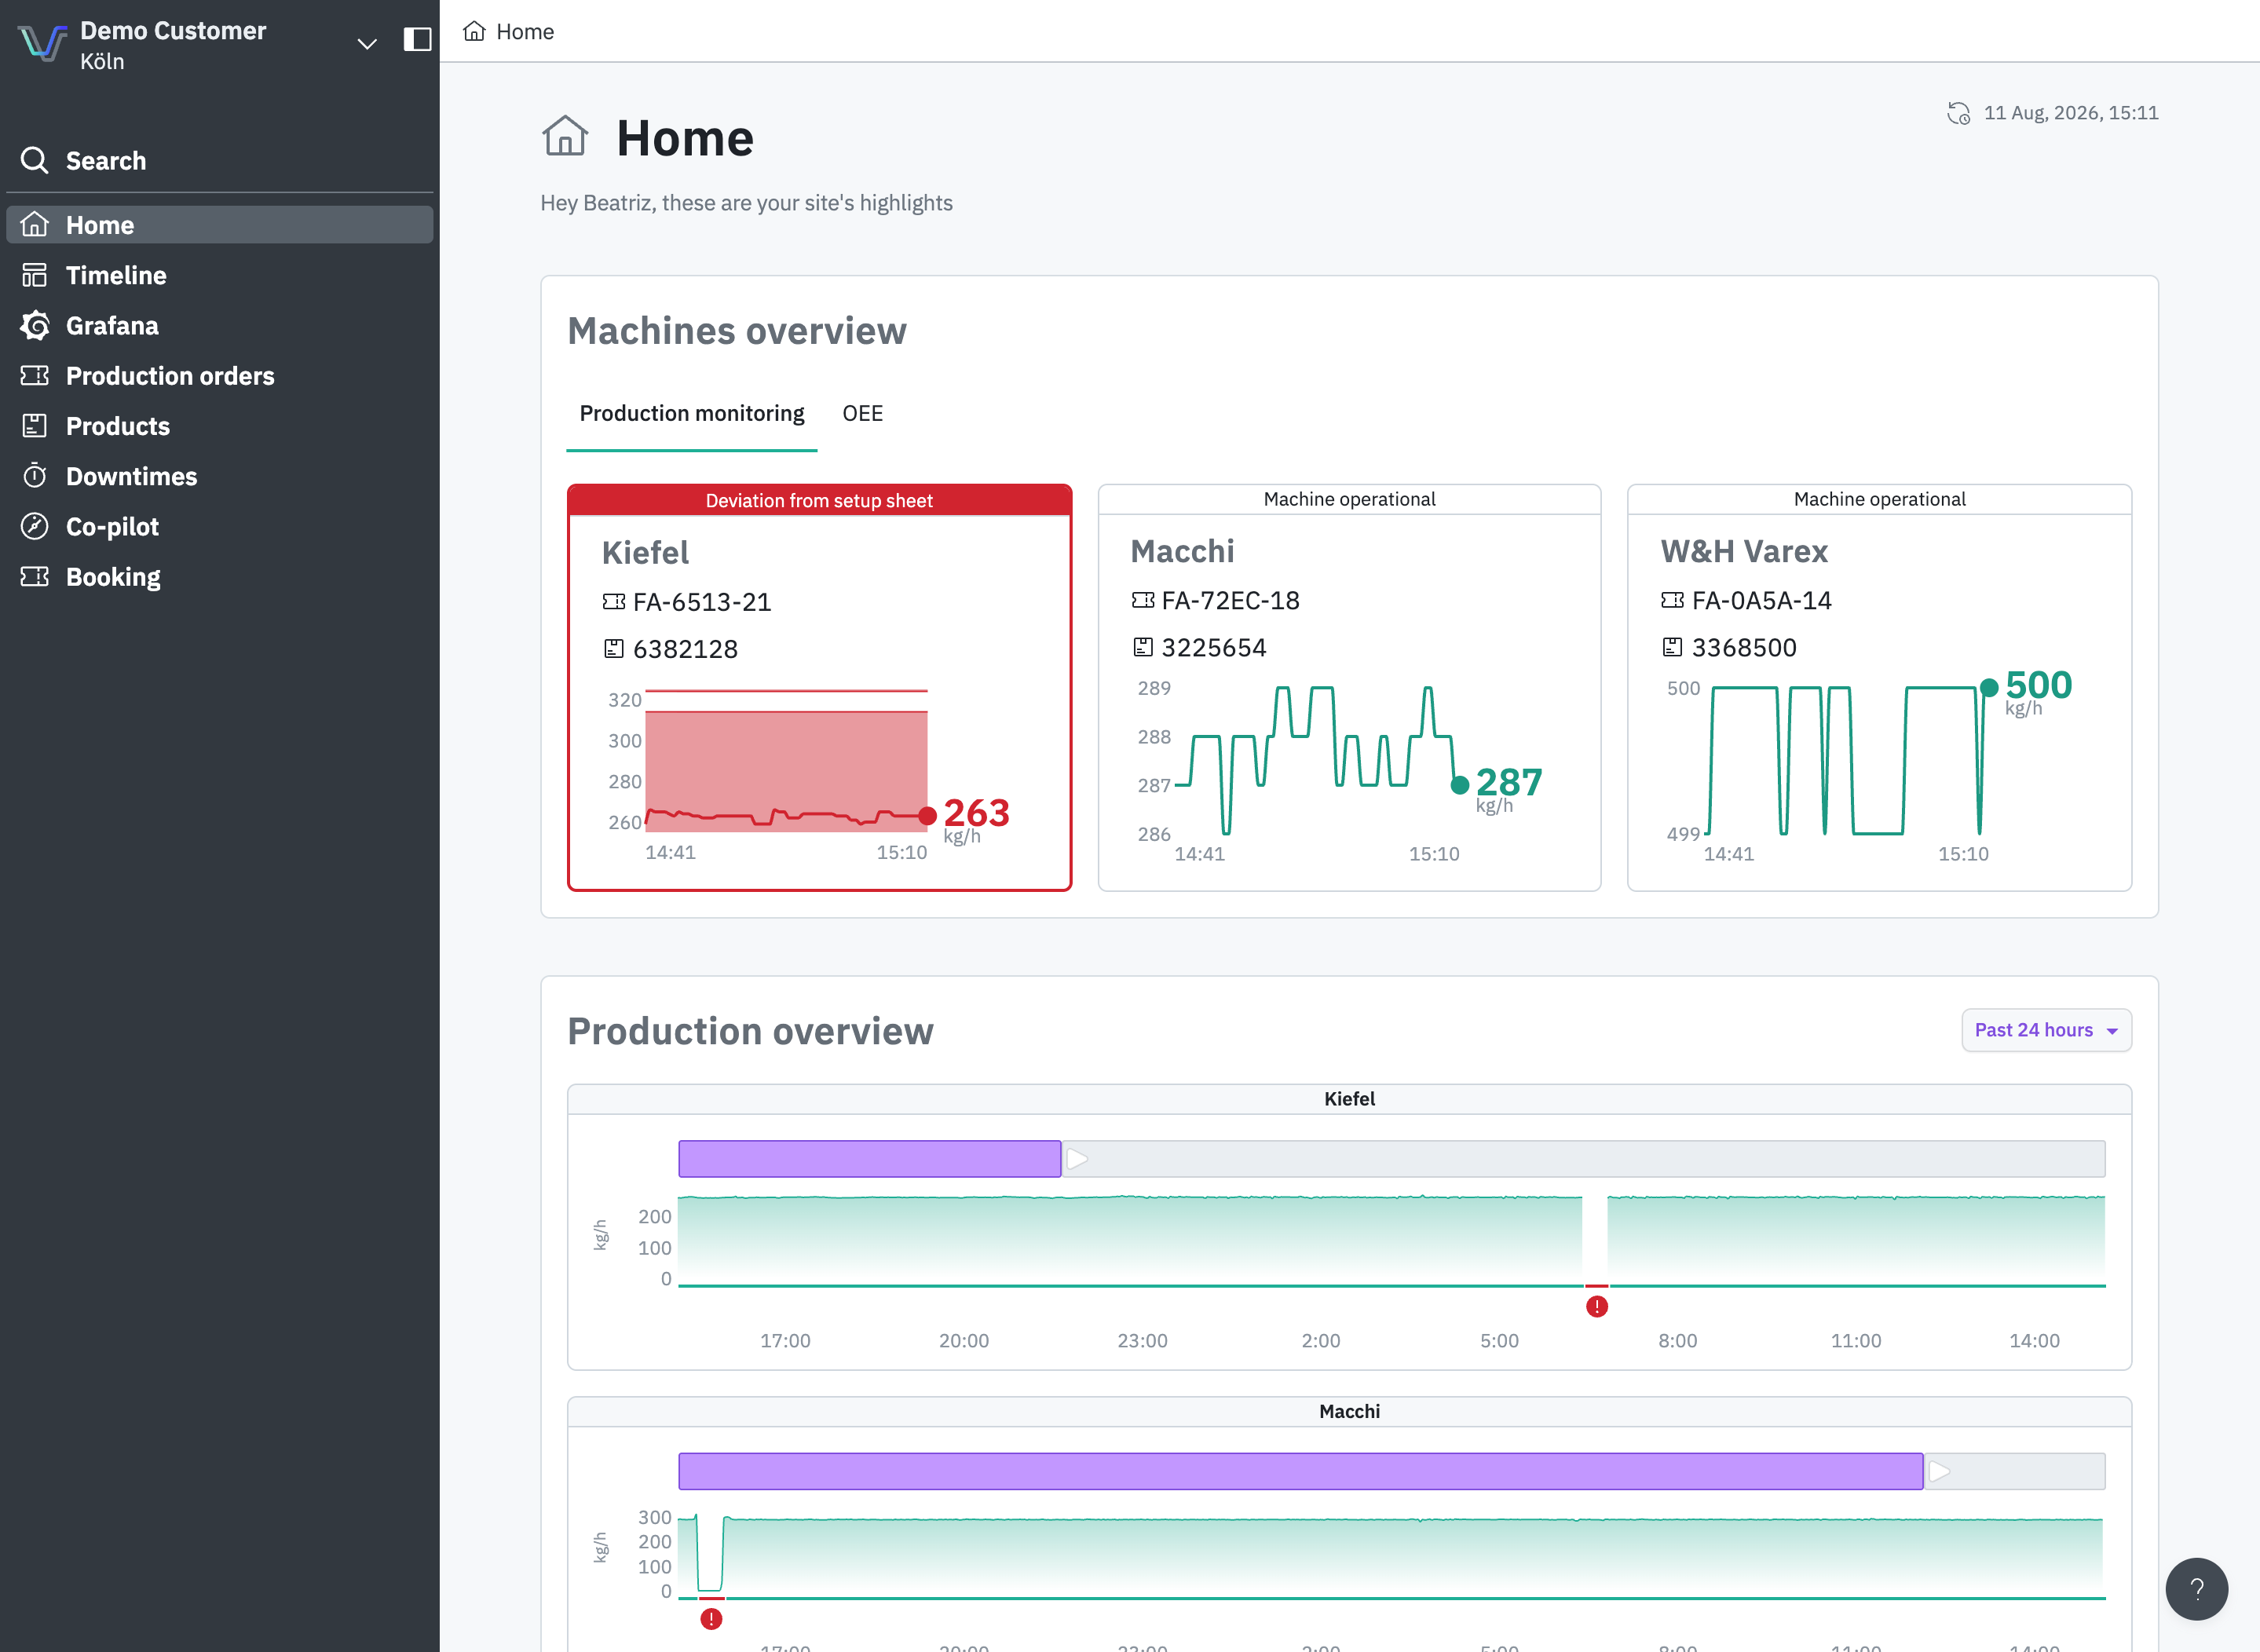
Instead of checking each machine individually, ENLYZE shows you the whole shopfloor in real time in one place: which machine is running, how the current production run is tracking, and where something needs attention right now.

For that, go to **Home**, your main workspace:

* **Machine cards**: one per machine, showing its real-time status: running, stopped, or needing attention.
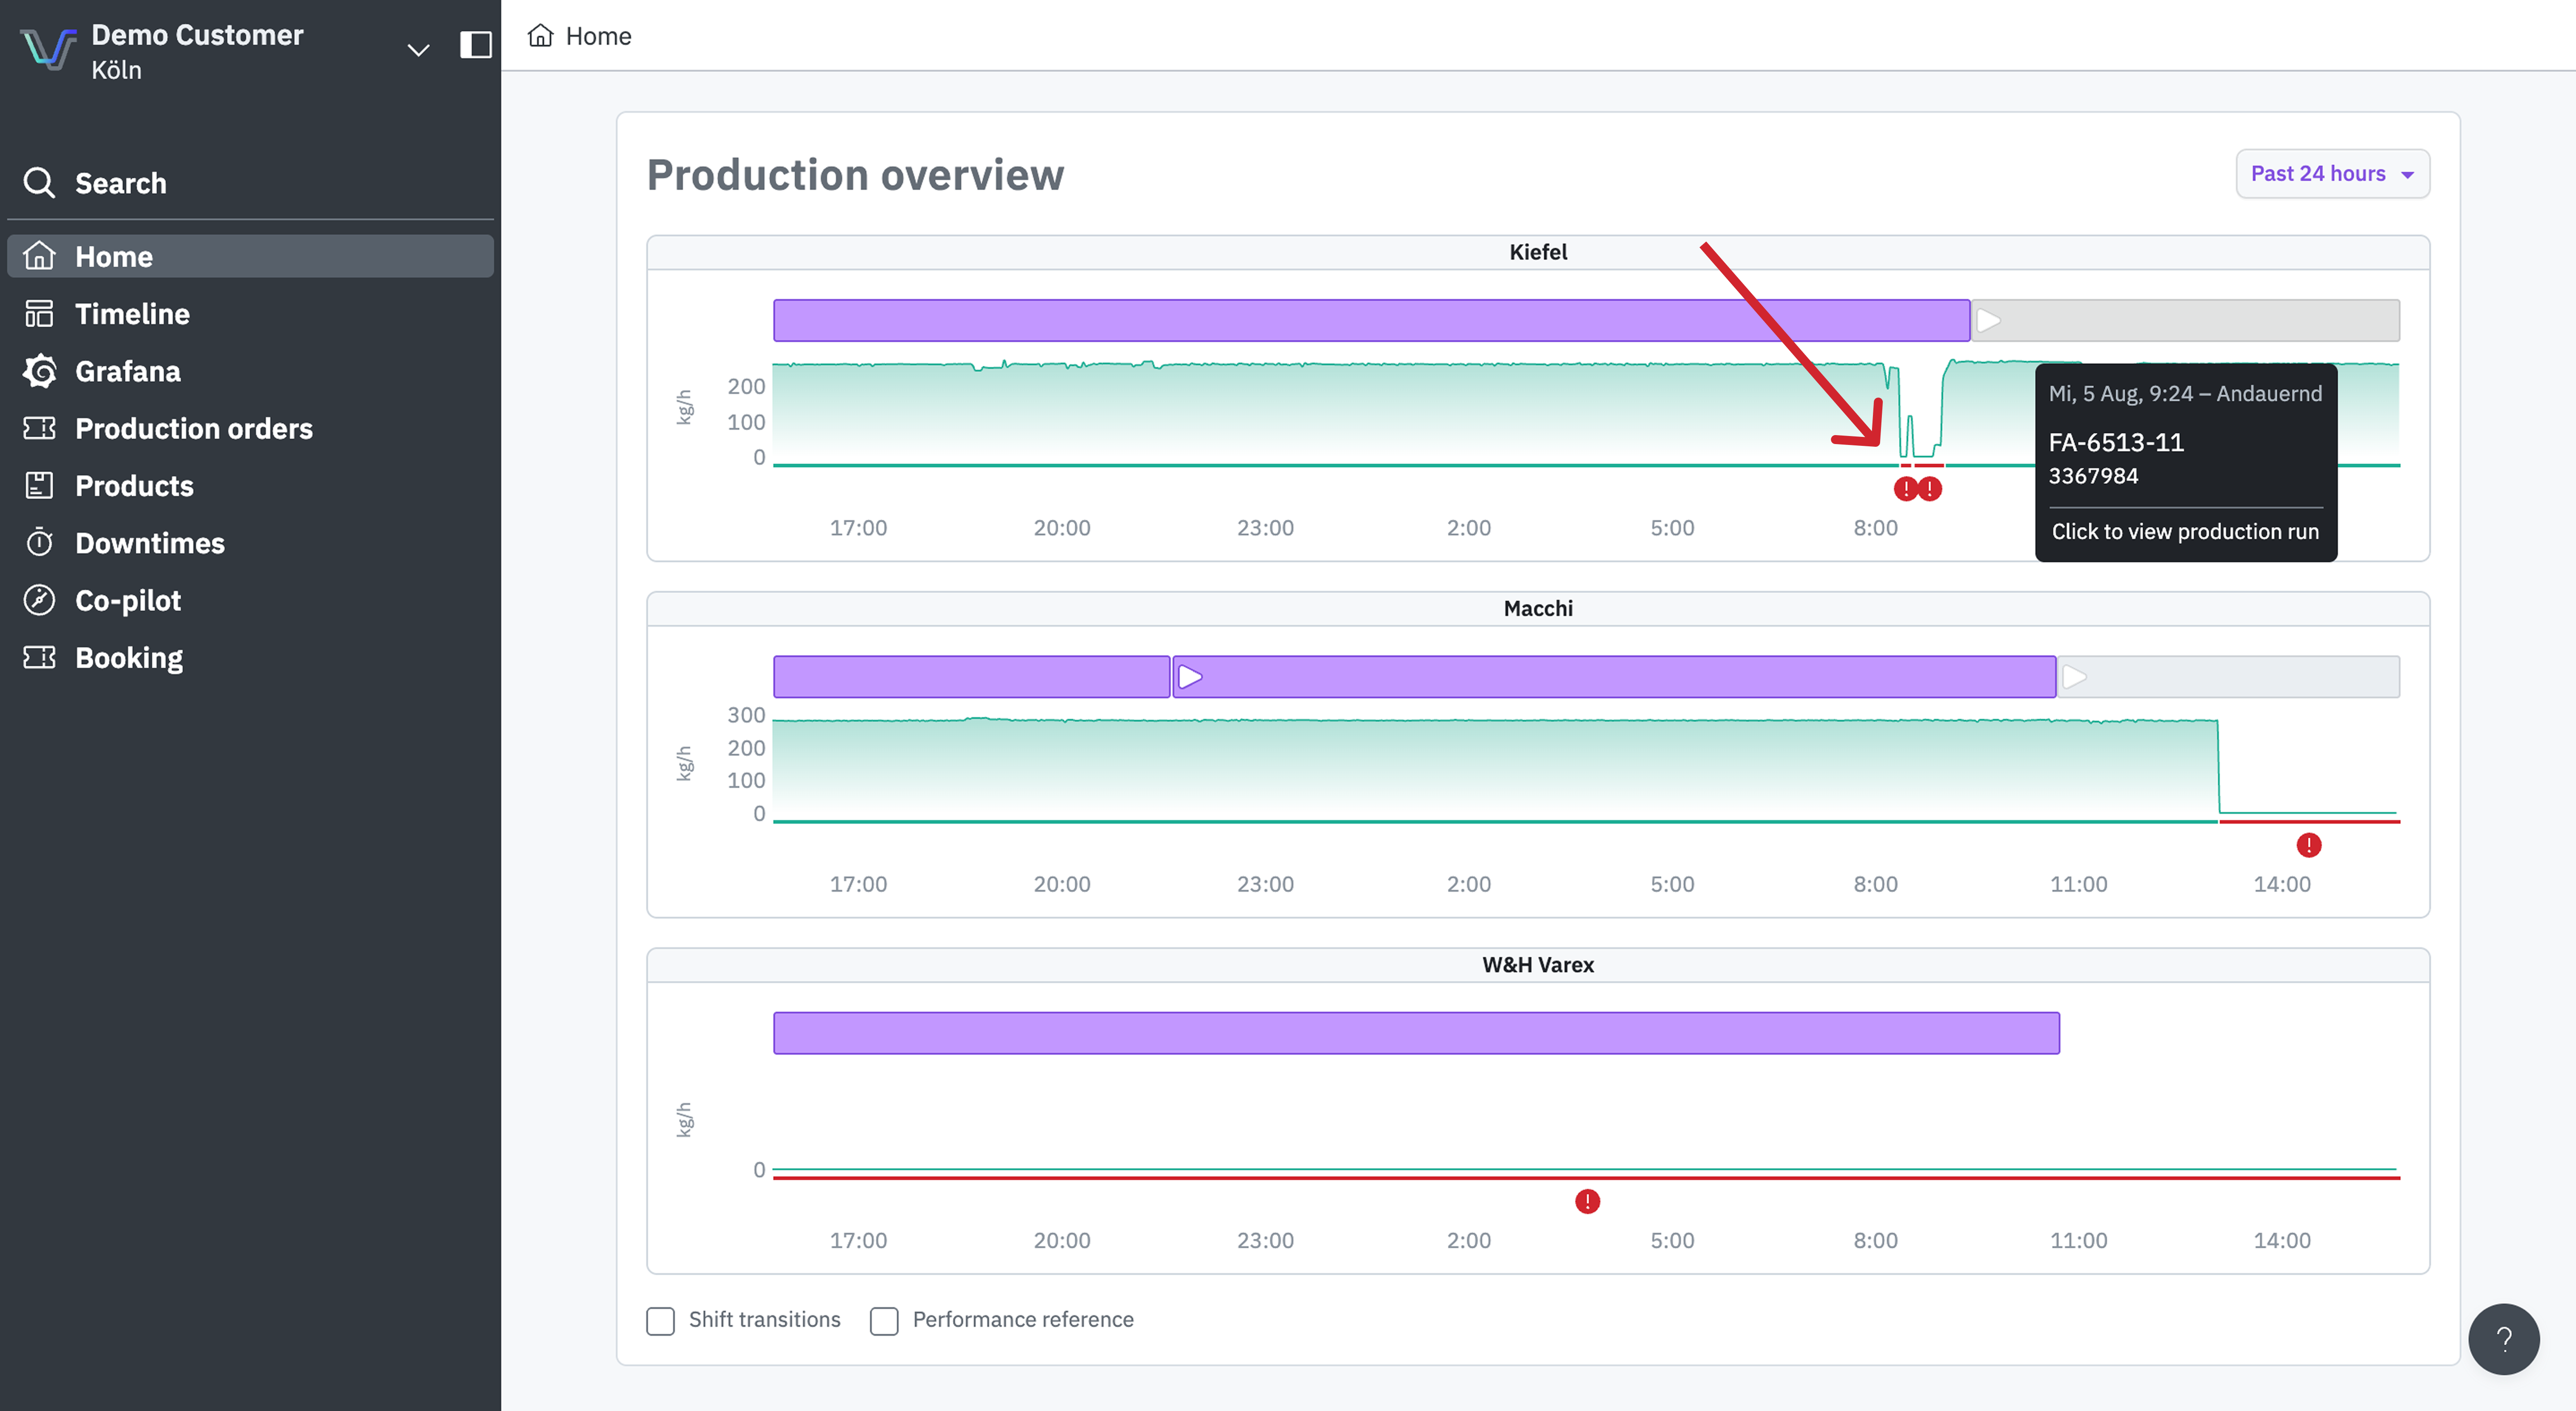
* **Production overview**: each machine's activity over time in one view. The **purple** bar is the production run, the **green** area is actual output, and **red** marks a downtime. Click the purple bar for the full production run: product, runtime, quantities, and OEE.
* **OEE summary**: how your site is currently performing.
* Top left corner: a dropdown to switch **site** and **app language**.

<figure><img src="https://4261006941-files.gitbook.io/~/files/v0/b/gitbook-x-prod.appspot.com/o/spaces%2FSNEuiyRRKwuqtIcaEt45%2Fuploads%2Fgit-blob-d95d20ce054b42684508947221fa376abd9f79f5%2Fgetting-started-operators-home-01.png?alt=media" alt="ENLYZE App home screen with machine cards, production overview, and OEE summary"><figcaption><p>The home screen: your shopfloor at a glance</p></figcaption></figure>

For looking beyond the moment: **Timeline** lets you dig into one machine's history and **Products** shows what's being made. Most of your work happens on Home though, including the next two cases.

## Contextualize downtimes

ENLYZE detects downtimes automatically. What the machine can't deliver is the "why". That's your job. Only with the reason does it become visible where runtime is lost, and recurring problems can be fixed. Each classified downtime also feeds the availability side of the machine's OEE.

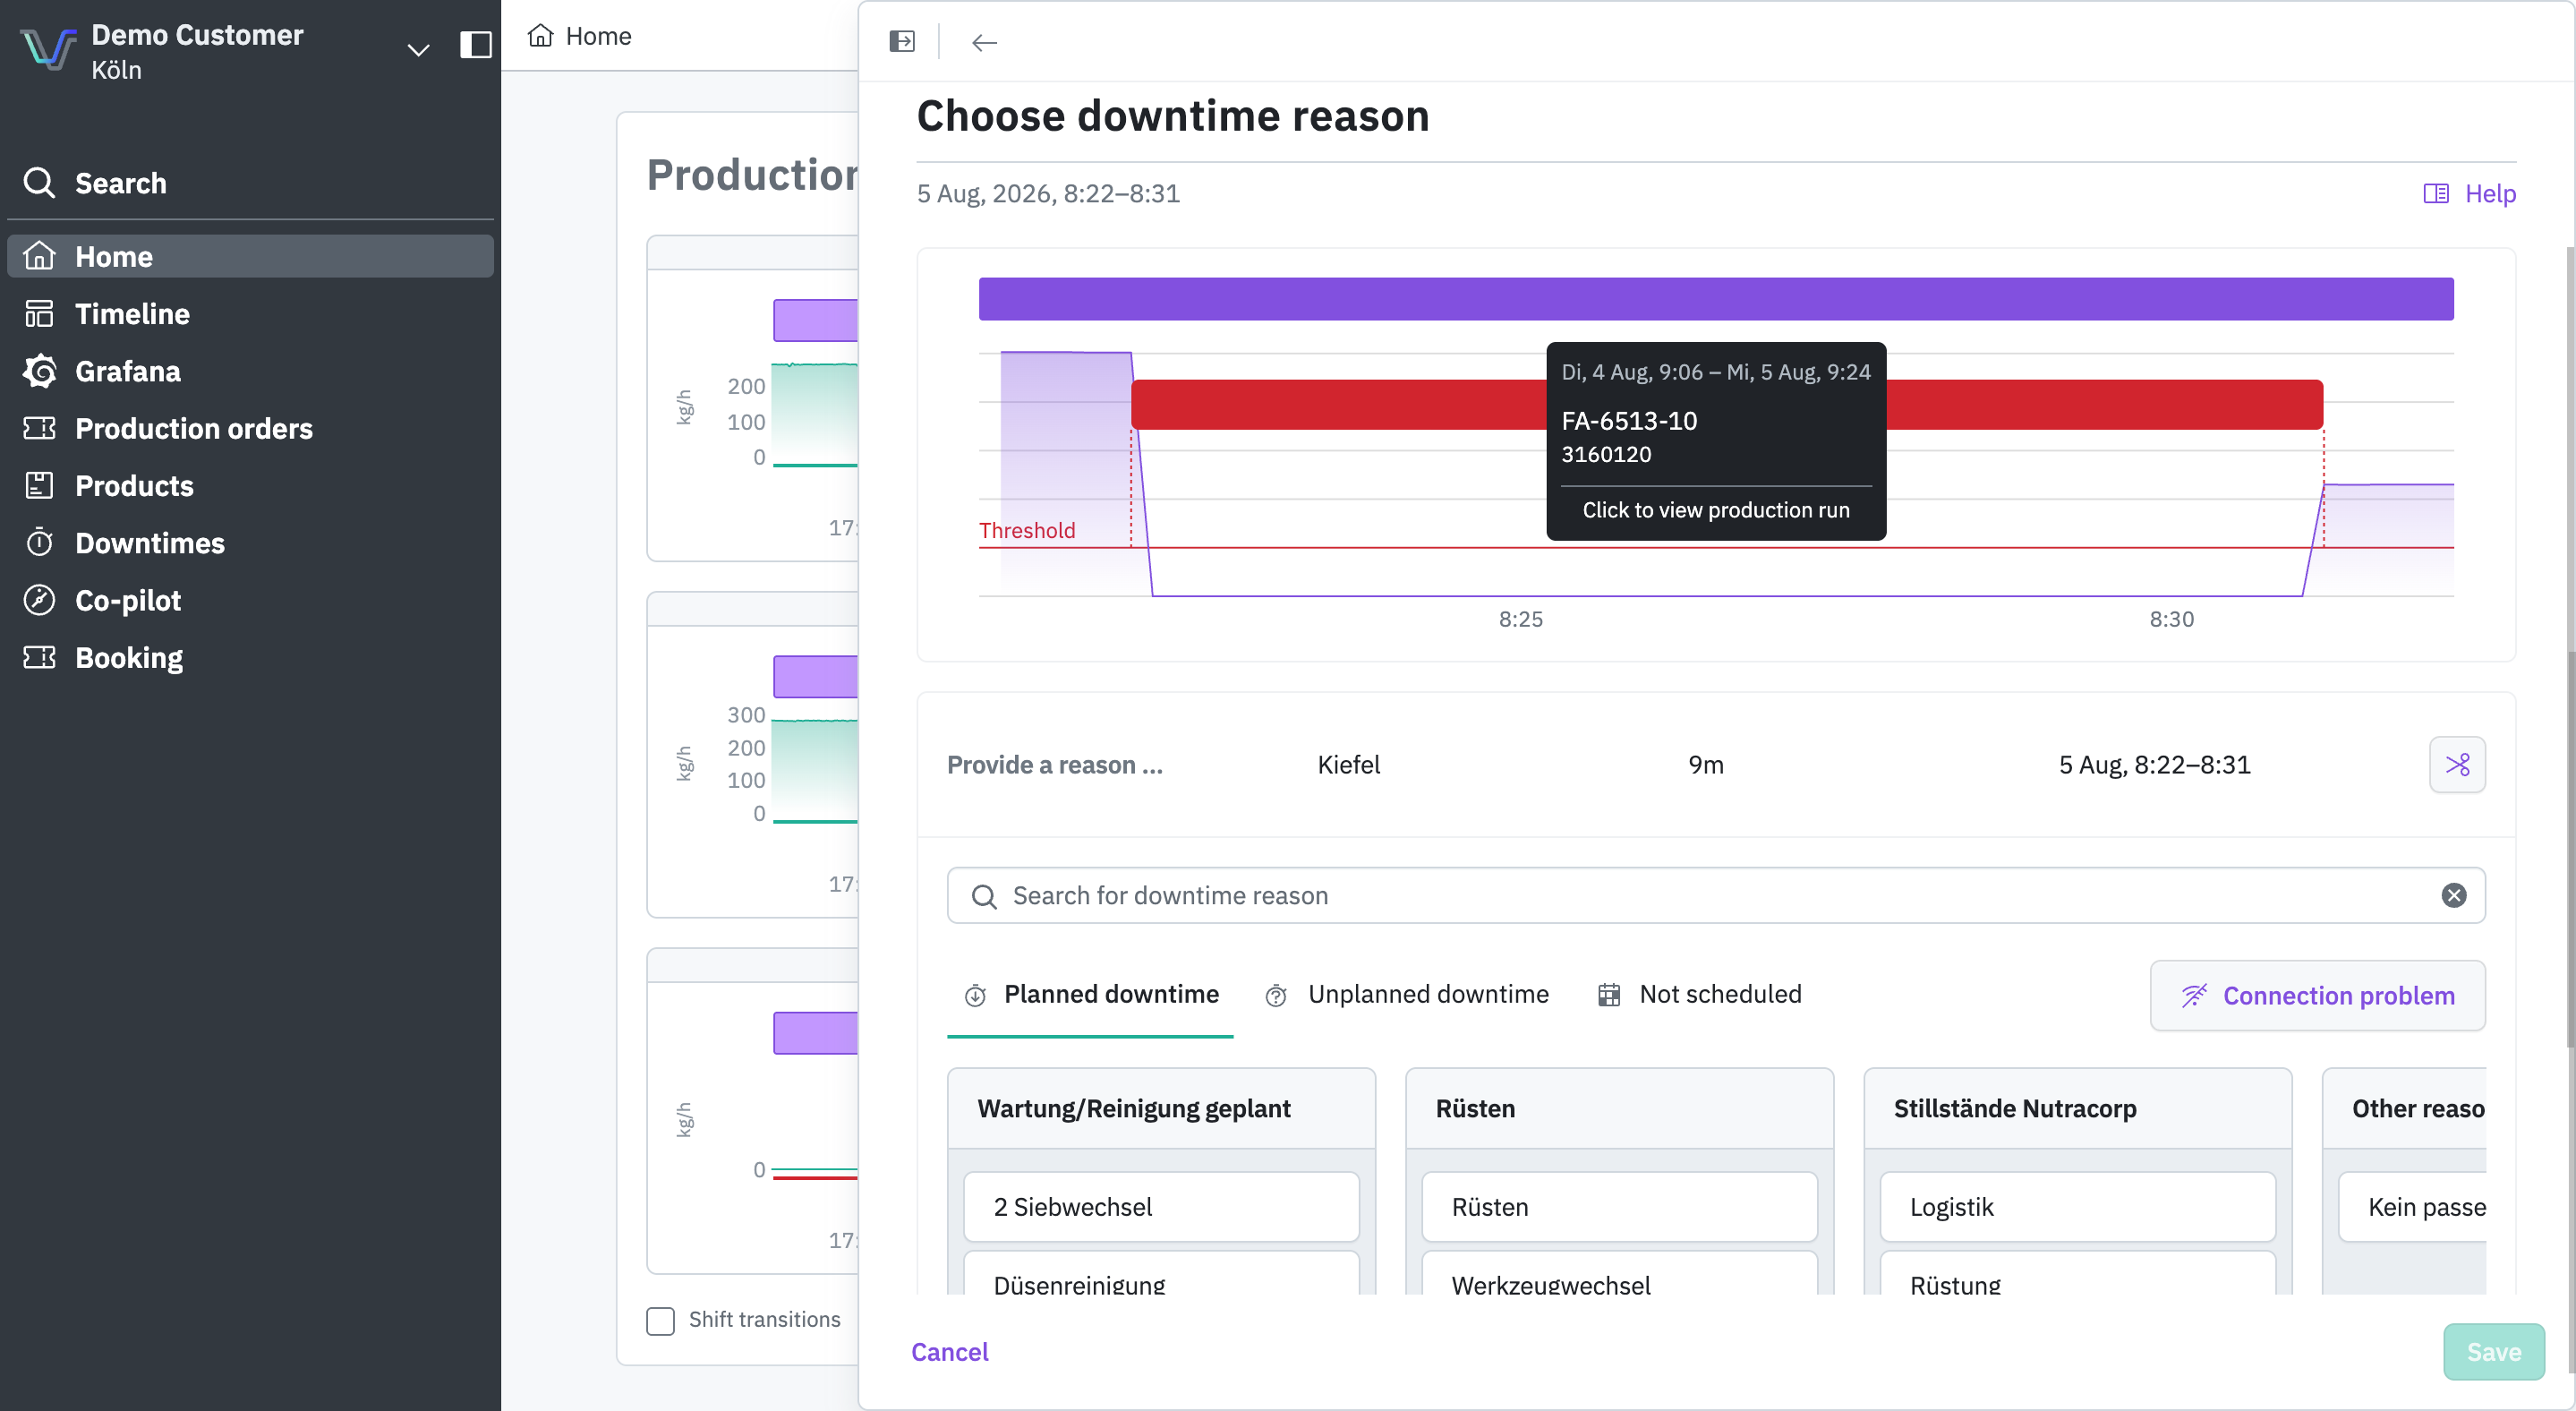
Detected downtimes appear on the machine's card as unclassified. Open the stop, select from the machine's downtime catalog, and correct the start and end timestamps if the auto-detected boundaries are off.

Where to find it: Home → the red exclamation icon on the stop → pick a reason → save

The catalog only holds reasons an Admin has set up. If the one you need isn't there, let them know.

<figure><img src="https://4261006941-files.gitbook.io/~/files/v0/b/gitbook-x-prod.appspot.com/o/spaces%2FSNEuiyRRKwuqtIcaEt45%2Fuploads%2Fgit-blob-b22c2bf127c4e87fbf991ef7768b9c030eaae867%2Fgetting-started-operators-downtime-marker-01.png?alt=media" alt="Production overview with an arrow pointing at the red exclamation marks below the trend"><figcaption><p>Detected downtimes appear as a red exclamation mark in the production overview</p></figcaption></figure>

<figure><img src="https://4261006941-files.gitbook.io/~/files/v0/b/gitbook-x-prod.appspot.com/o/spaces%2FSNEuiyRRKwuqtIcaEt45%2Fuploads%2Fgit-blob-0162b68765b693471ceeb5dd439cb8d2d203a6ad%2Fgetting-started-operators-downtime-reason-01.png?alt=media" alt="Choose downtime reason dialog with category tabs, search field, and the catalogue of reasons"><figcaption><p>Pick the reason from the catalogue in the downtime editor</p></figcaption></figure>

Full details: [Assign reasons to downtimes](/en/production-optimization/downtimes/assigning-reasons.md)

## Produce products to spec

Every product has target parameters and tolerances from its setup sheet. The **Co-Pilot** compares them against live machine values, filtered down to what's relevant on the floor. That way you start a changeover with the right settings and see during production whether you're in spec, before scrap is produced.

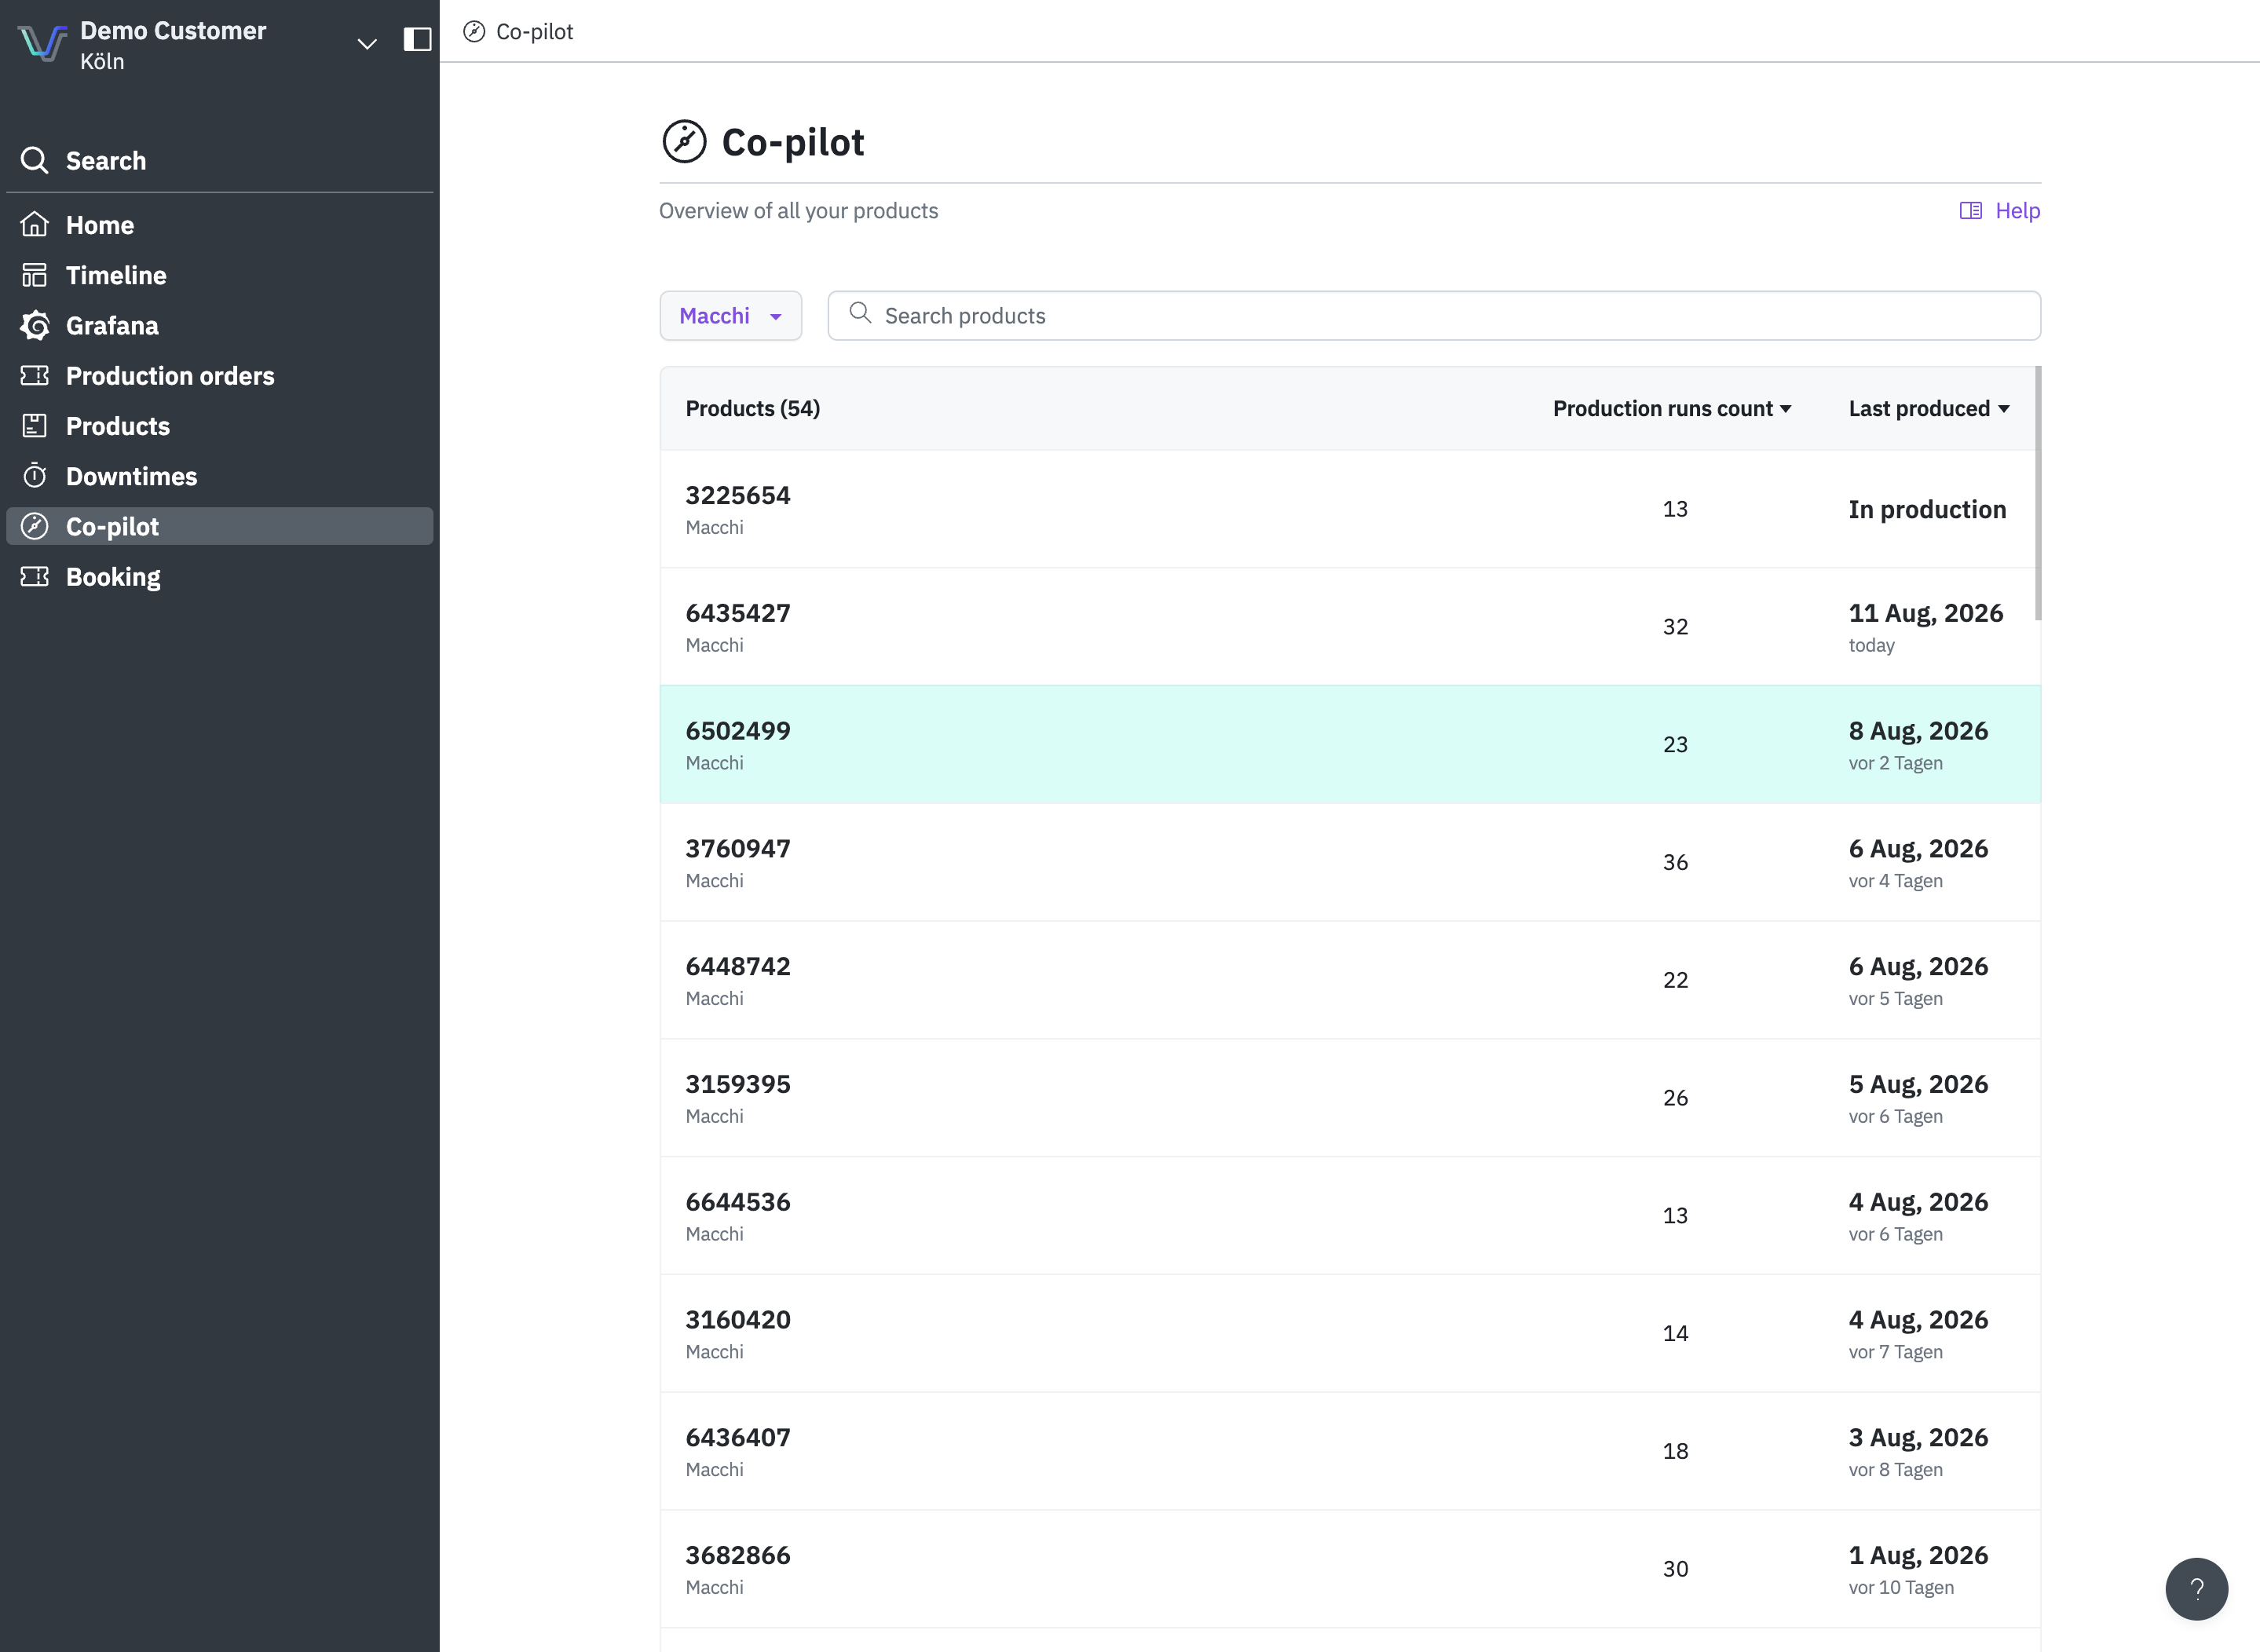
Open it from **Co-Pilot** in the sidebar and select your machine. The product currently running is at the top, marked **In production**, verify it's correct, especially right after a changeover, since that assignment can lag.

<figure><img src="https://4261006941-files.gitbook.io/~/files/v0/b/gitbook-x-prod.appspot.com/o/spaces%2FSNEuiyRRKwuqtIcaEt45%2Fuploads%2Fgit-blob-e39257423c144ae86ef5c52c7ca1d88721f5ccbd%2Fgetting-started-operators-copilot-products-01.png?alt=media" alt="Co-Pilot product list with a machine selected and the running product marked In production"><figcaption><p>The Co-Pilot product list, with the running product marked In production</p></figcaption></figure>

Two views, switch anytime:

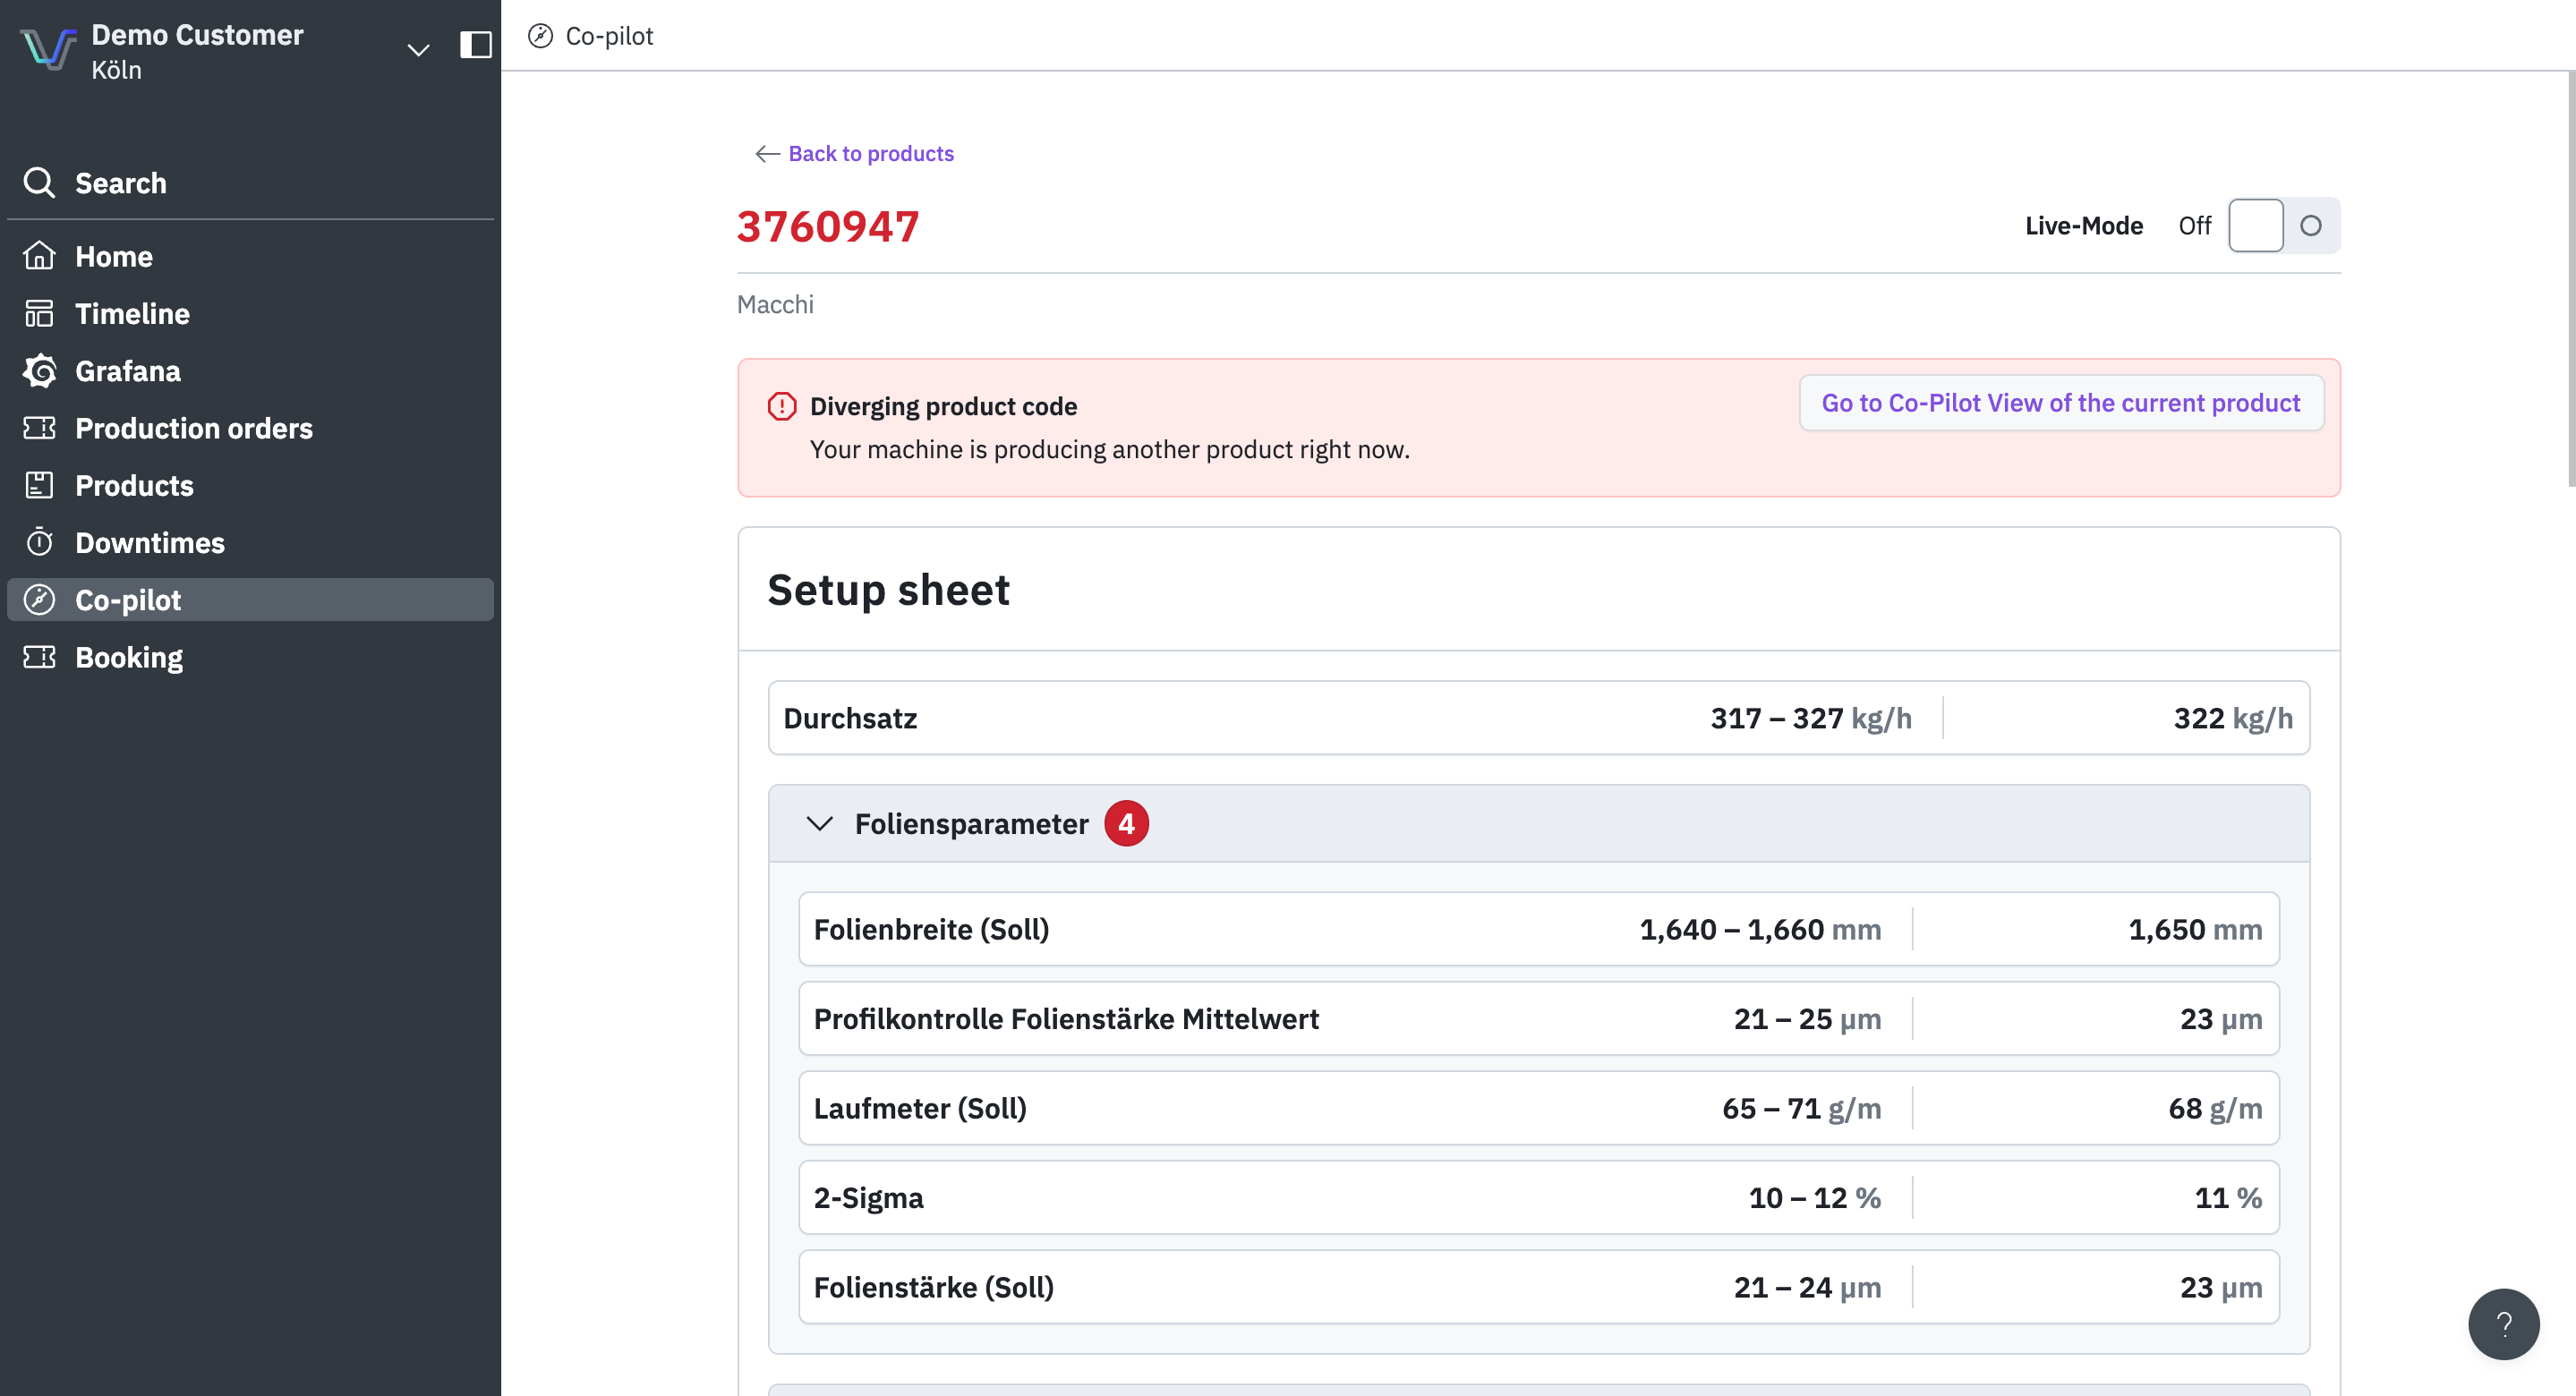
* **Static view**: targets and tolerances on their own. Good for prepping a changeover.
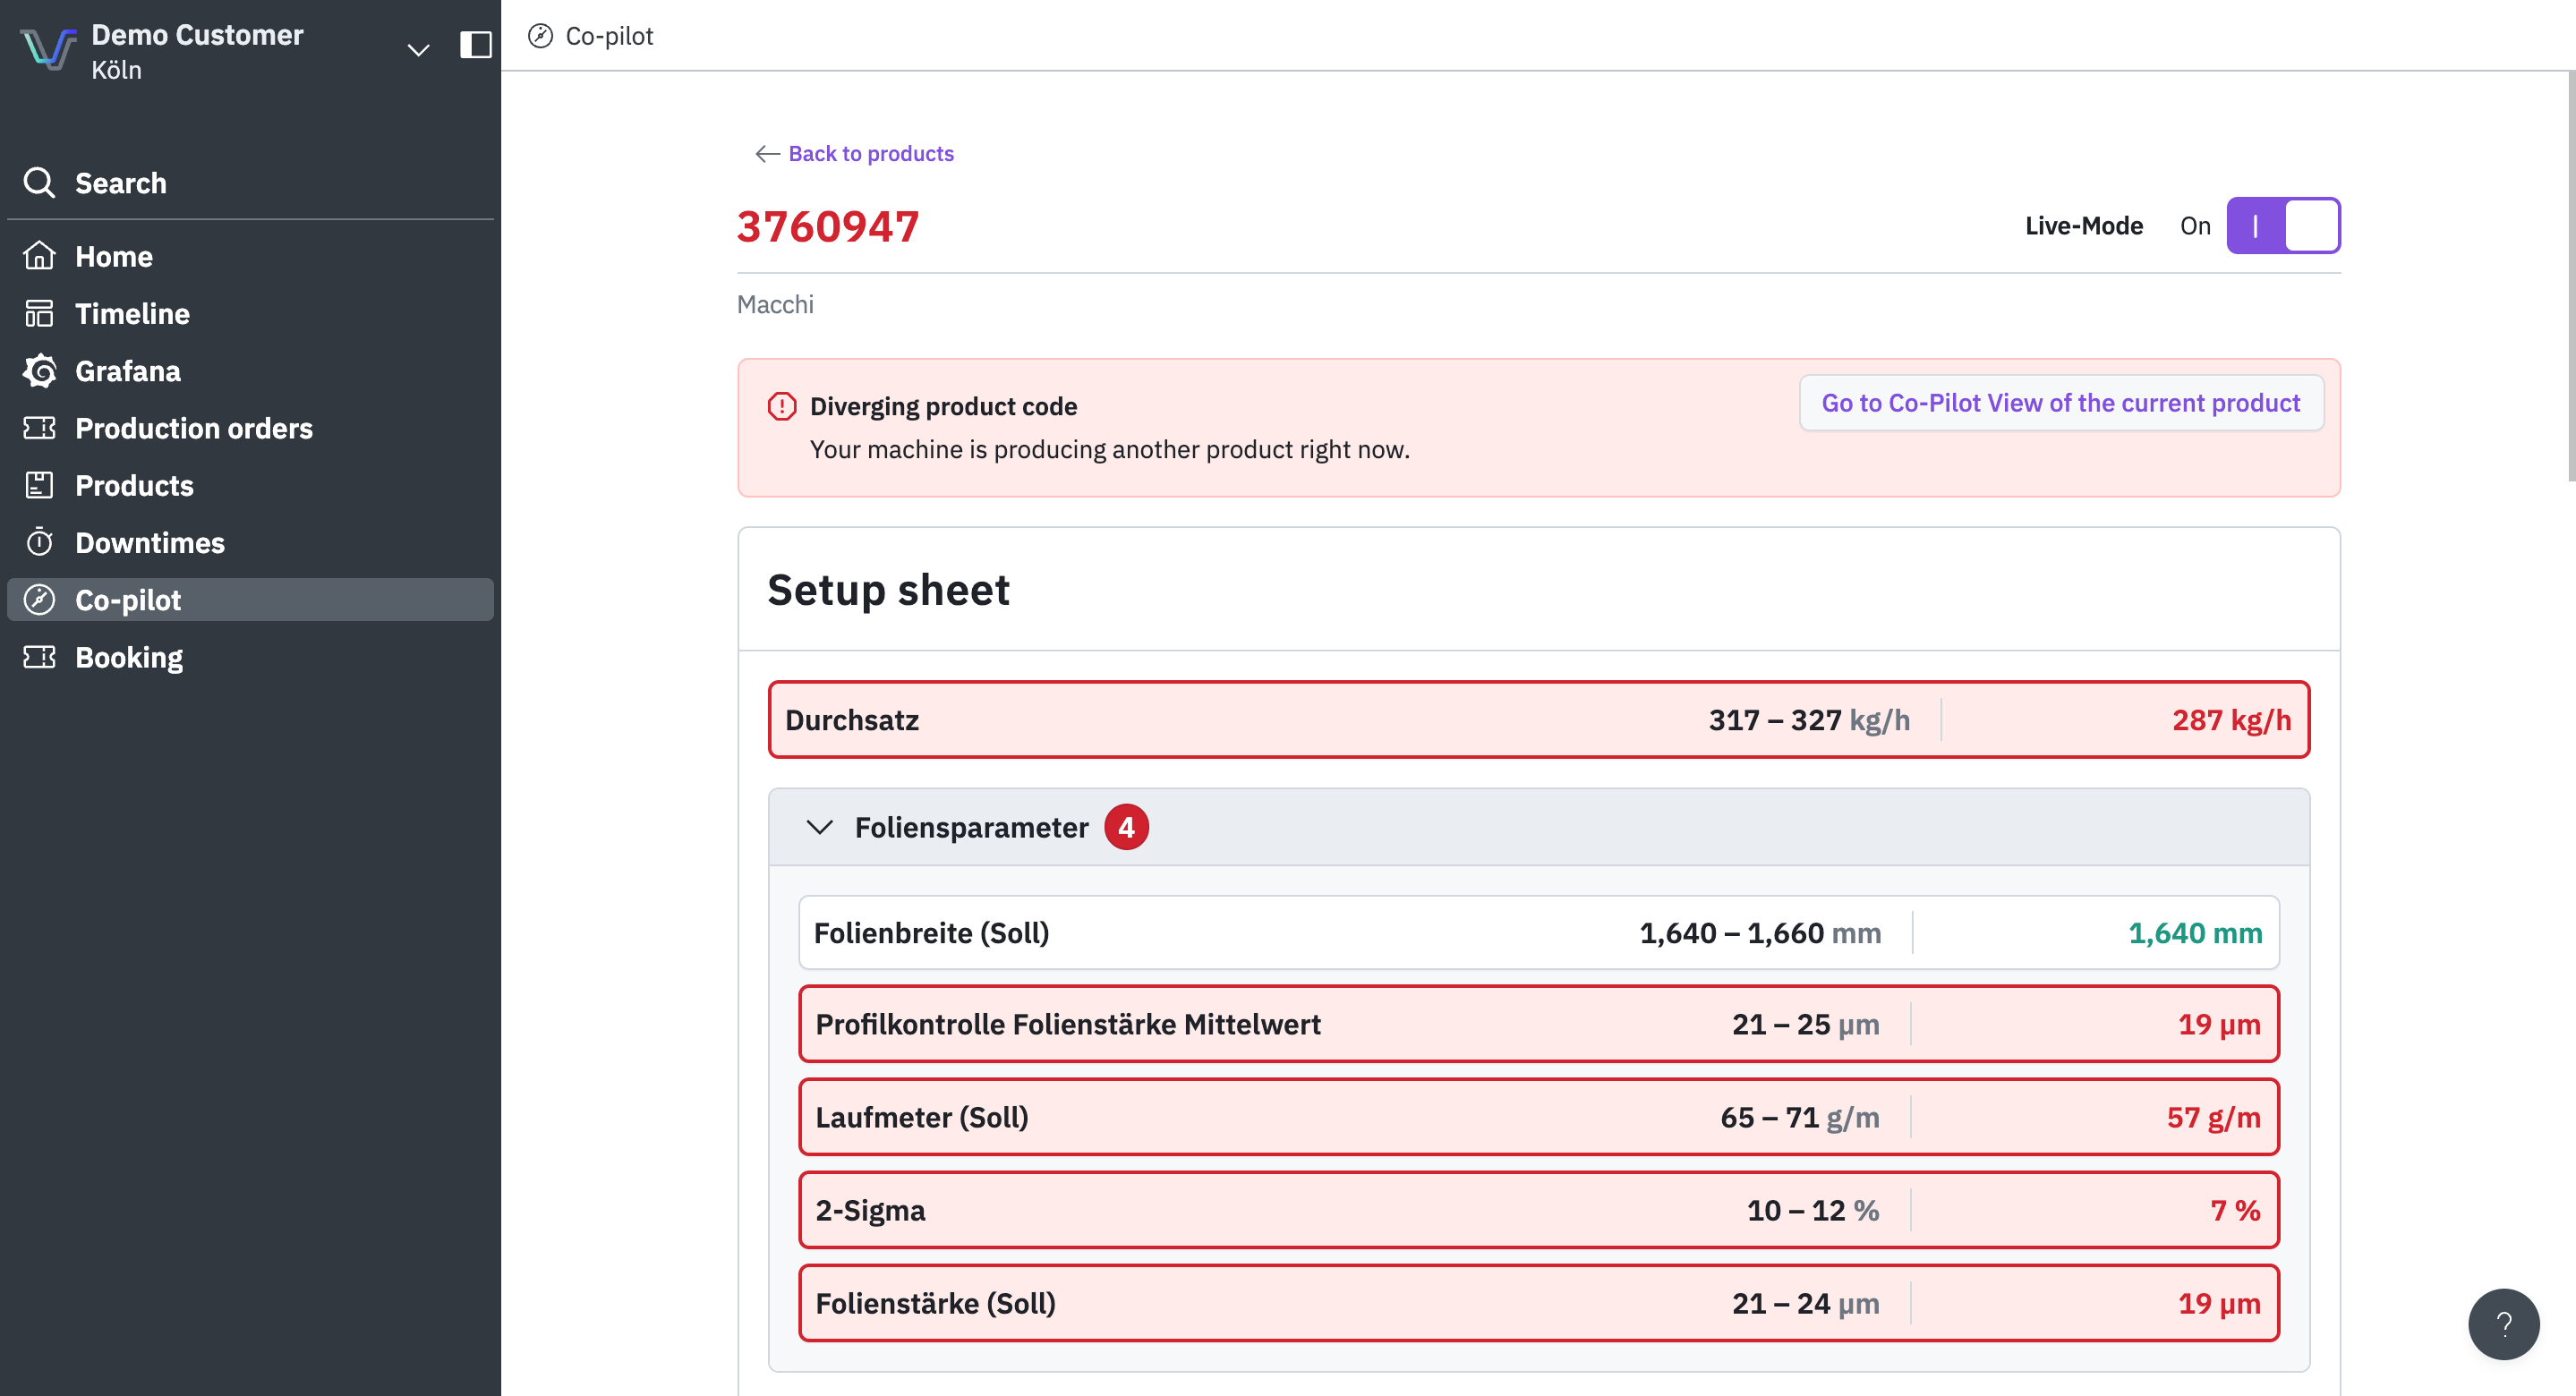
* **Live view**: targets against live values. **Red** means a parameter is drifting (tap it for a 30-minute trend chart); **green** means you're in spec.

<figure><img src="https://4261006941-files.gitbook.io/~/files/v0/b/gitbook-x-prod.appspot.com/o/spaces%2FSNEuiyRRKwuqtIcaEt45%2Fuploads%2Fgit-blob-608857c0af53cae9352caa118dffaf656ac75f25%2Fgetting-started-operators-copilot-static-01.png?alt=media" alt="Static view of the Co-Pilot with the target values and tolerances from the setup sheet"><figcaption><p>Static view, Live-Mode off</p></figcaption></figure>

<figure><img src="https://4261006941-files.gitbook.io/~/files/v0/b/gitbook-x-prod.appspot.com/o/spaces%2FSNEuiyRRKwuqtIcaEt45%2Fuploads%2Fgit-blob-a06e50cf03e474d0eab88343e1691401543a5a74%2Fgetting-started-operators-copilot-live-01.png?alt=media" alt="Live view of the Co-Pilot with several deviating parameters marked in red"><figcaption><p>Live view, Live-Mode on: deviating parameters are marked in red</p></figcaption></figure>

The Co-Pilot needs a setup sheet configured for the product. No sheet, or a missing parameter, is an Admin setup task, let them know.

Full details: [Co-Pilot](/en/production-optimization/co-pilot.md)

{% hint style="info" %}
The Co-Pilot only works once a setup sheet has been configured for the product. If you see "setup sheet not configured," that's for management to set up.
{% endhint %}

## Getting help

* **The question mark button in the app**: type your question and it answers straight from the docs. If the answer isn't there, our support team takes over.
* **These docs**: everything about ENLYZE lives at [Welcome to ENLYZE](/en/readme.md), searchable anytime.

## Printable version

Want it on the wall by the machine? Download the one-page operator guide, print it, and hang it where the crew can see it. It covers the essentials and has a QR code back to this page for anything more.

{% file src="/files/m63jSRIrtSQ9fCr42kMK" %}
Printable operator one-pager (A4)
{% endfile %}