> For the complete documentation index, see [llms.txt](https://docs.enlyze.com/llms.txt). Markdown versions of documentation pages are available by appending `.md` to page URLs; this page is available as [Markdown](https://docs.enlyze.com/en/production-optimization/analysis/batch-record.md).
# Batch record
Produce a target-versus-actual record for a single production run.
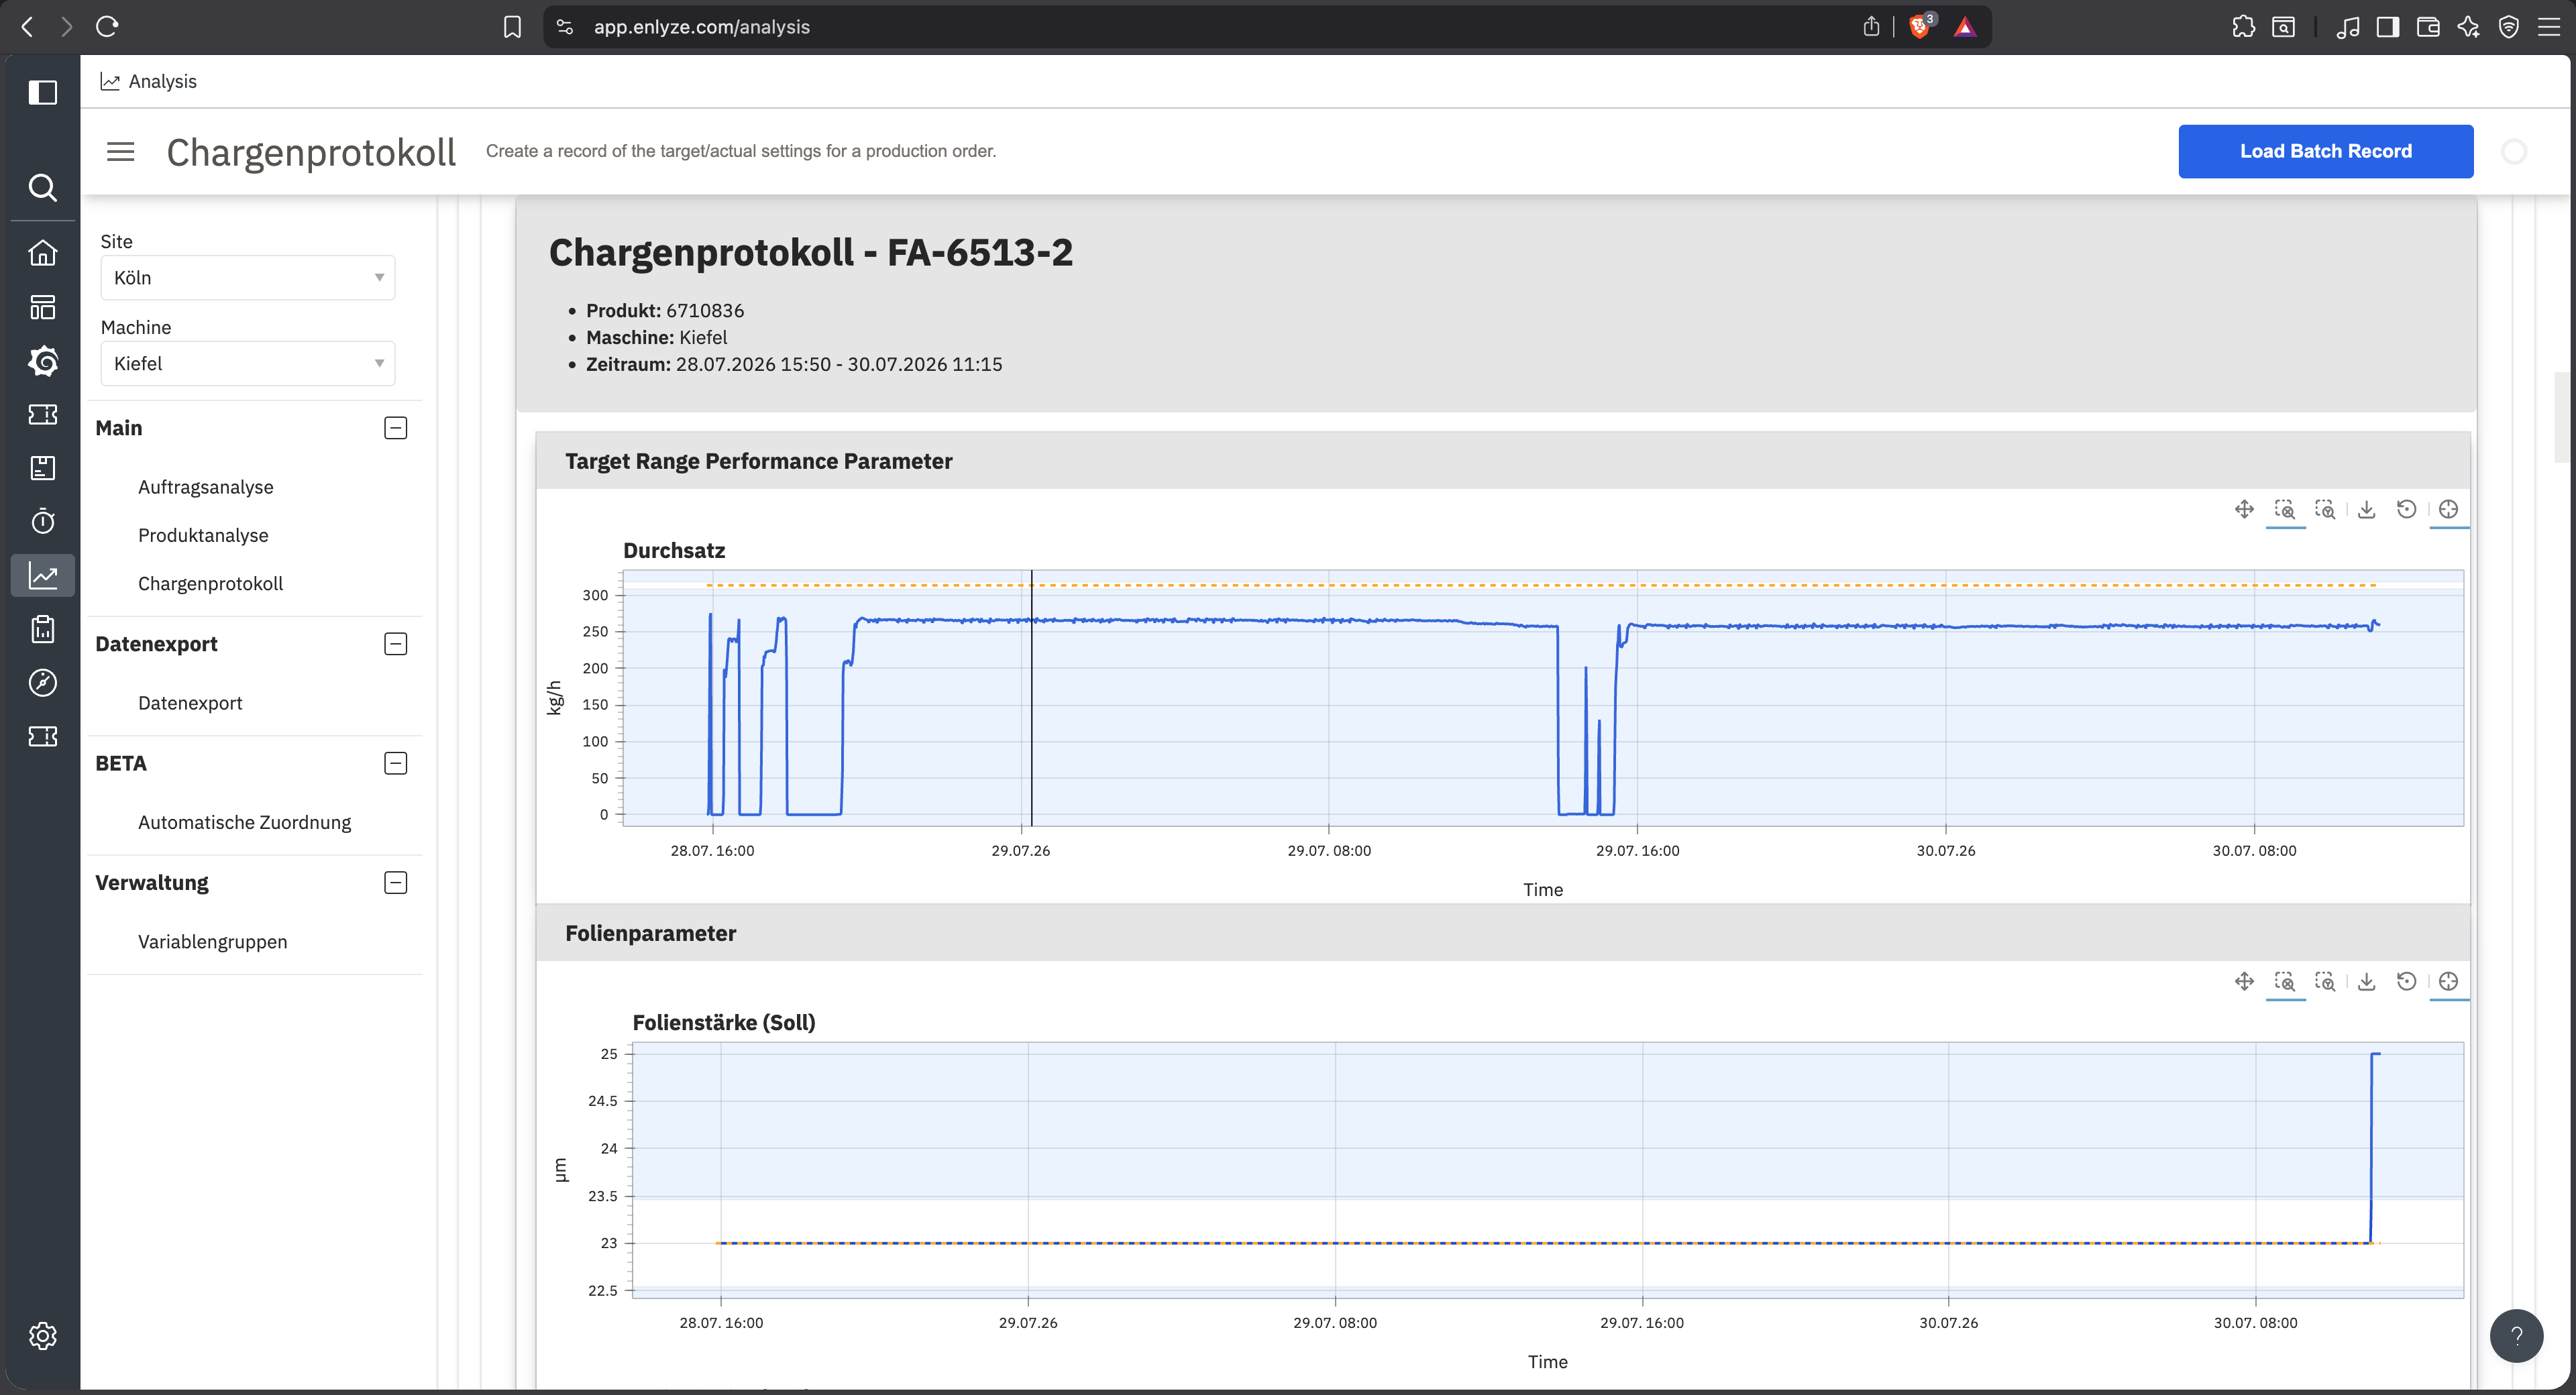
The batch record documents a single production run: which target values the setup sheet specified, which actual values the machine delivered, and how the progression looked against the tolerances. The result is a printable page you can attach to a batch or hand over on request.
Target-actual table on top, per-parameter progression against the tolerance band below
## Prerequisites
* A production run booked on the selected machine
* A [setup sheet](/en/production-optimization/setup-sheet.md) for the product made
{% hint style="info" %}
Without a setup sheet there are no target values to compare against. In the ENLYZE app the **Open batch record** button is disabled in that case.
{% endhint %}
## How it works
{% stepper %}
{% step %}
## Select site and machine
In the sidebar.
{% endstep %}
{% step %}
## Select the run
The run table lists this machine's production runs. Pick the one you want to document.
{% endstep %}
{% step %}
## Load the record
Select **Load batch record** at the top right.
{% endstep %}
{% endstepper %}
## What the record contains
The header names the run number, **Product**, **Machine** and the run's **Time Range**.
Below it sits the target-actual table, one row per parameter: **Parameter**, **Target**, **Actual (ø)** and **Unit**. A dash under **Target** means the setup sheet defines no target for that parameter, so it is documented with its actual value only.
Then comes a progression plot per parameter group. The shaded band shows the tolerances from the setup sheet, the dashed line the target value. Parameters with no tolerances defined appear labelled **\[Tolerances not configured]** and without a band.
## Output
Two buttons below the table:
* **Download CSV** gives you the target-actual table as a file for further processing.
* **Print Version** opens a print-ready view. Use your browser's print dialog to turn it into a PDF.
## Language and time zone
The record follows the language set in your profile. See [Manage profile](/en/administration/manage-profile.md).
Timestamps are rendered in the site's time zone, not your browser's. A run at a site in another time zone shows the times valid there.
## Common questions
Why does a parameter say tolerances are not configured?
The parameter is in the setup sheet but has no limits there. Add the tolerances to the setup sheet and load the record again.
Can I generate records for several runs at once?
No, the batch record works one run at a time. To evaluate several runs of the same product, use [Product analysis](/en/production-optimization/analysis/product-analysis.md).
The actual value differs from the mean in production run analysis.
Expected. The statistics views in [Production run analysis](/en/production-optimization/analysis/production-run-analysis.md) cover production time only, while the record documents the run's full time range.
## Related topics
* [Setup sheet](/en/production-optimization/setup-sheet.md) to define target values and tolerances.
* [Product analysis](/en/production-optimization/analysis/product-analysis.md) for the view across several batches.