> For the complete documentation index, see [llms.txt](https://docs.enlyze.com/llms.txt). Markdown versions of documentation pages are available by appending `.md` to page URLs; this page is available as [Markdown](https://docs.enlyze.com/en/production-optimization/analysis/data-export.md).

# Data export

Export metrics, timeseries and downtimes as CSV or Excel, or inspect the variable configuration.

Data export gets data out of the platform when you want to work with it elsewhere, in Excel, Power BI or a report of your own. It also shows which variables a machine delivers and whether they are recorded consistently across all machines.

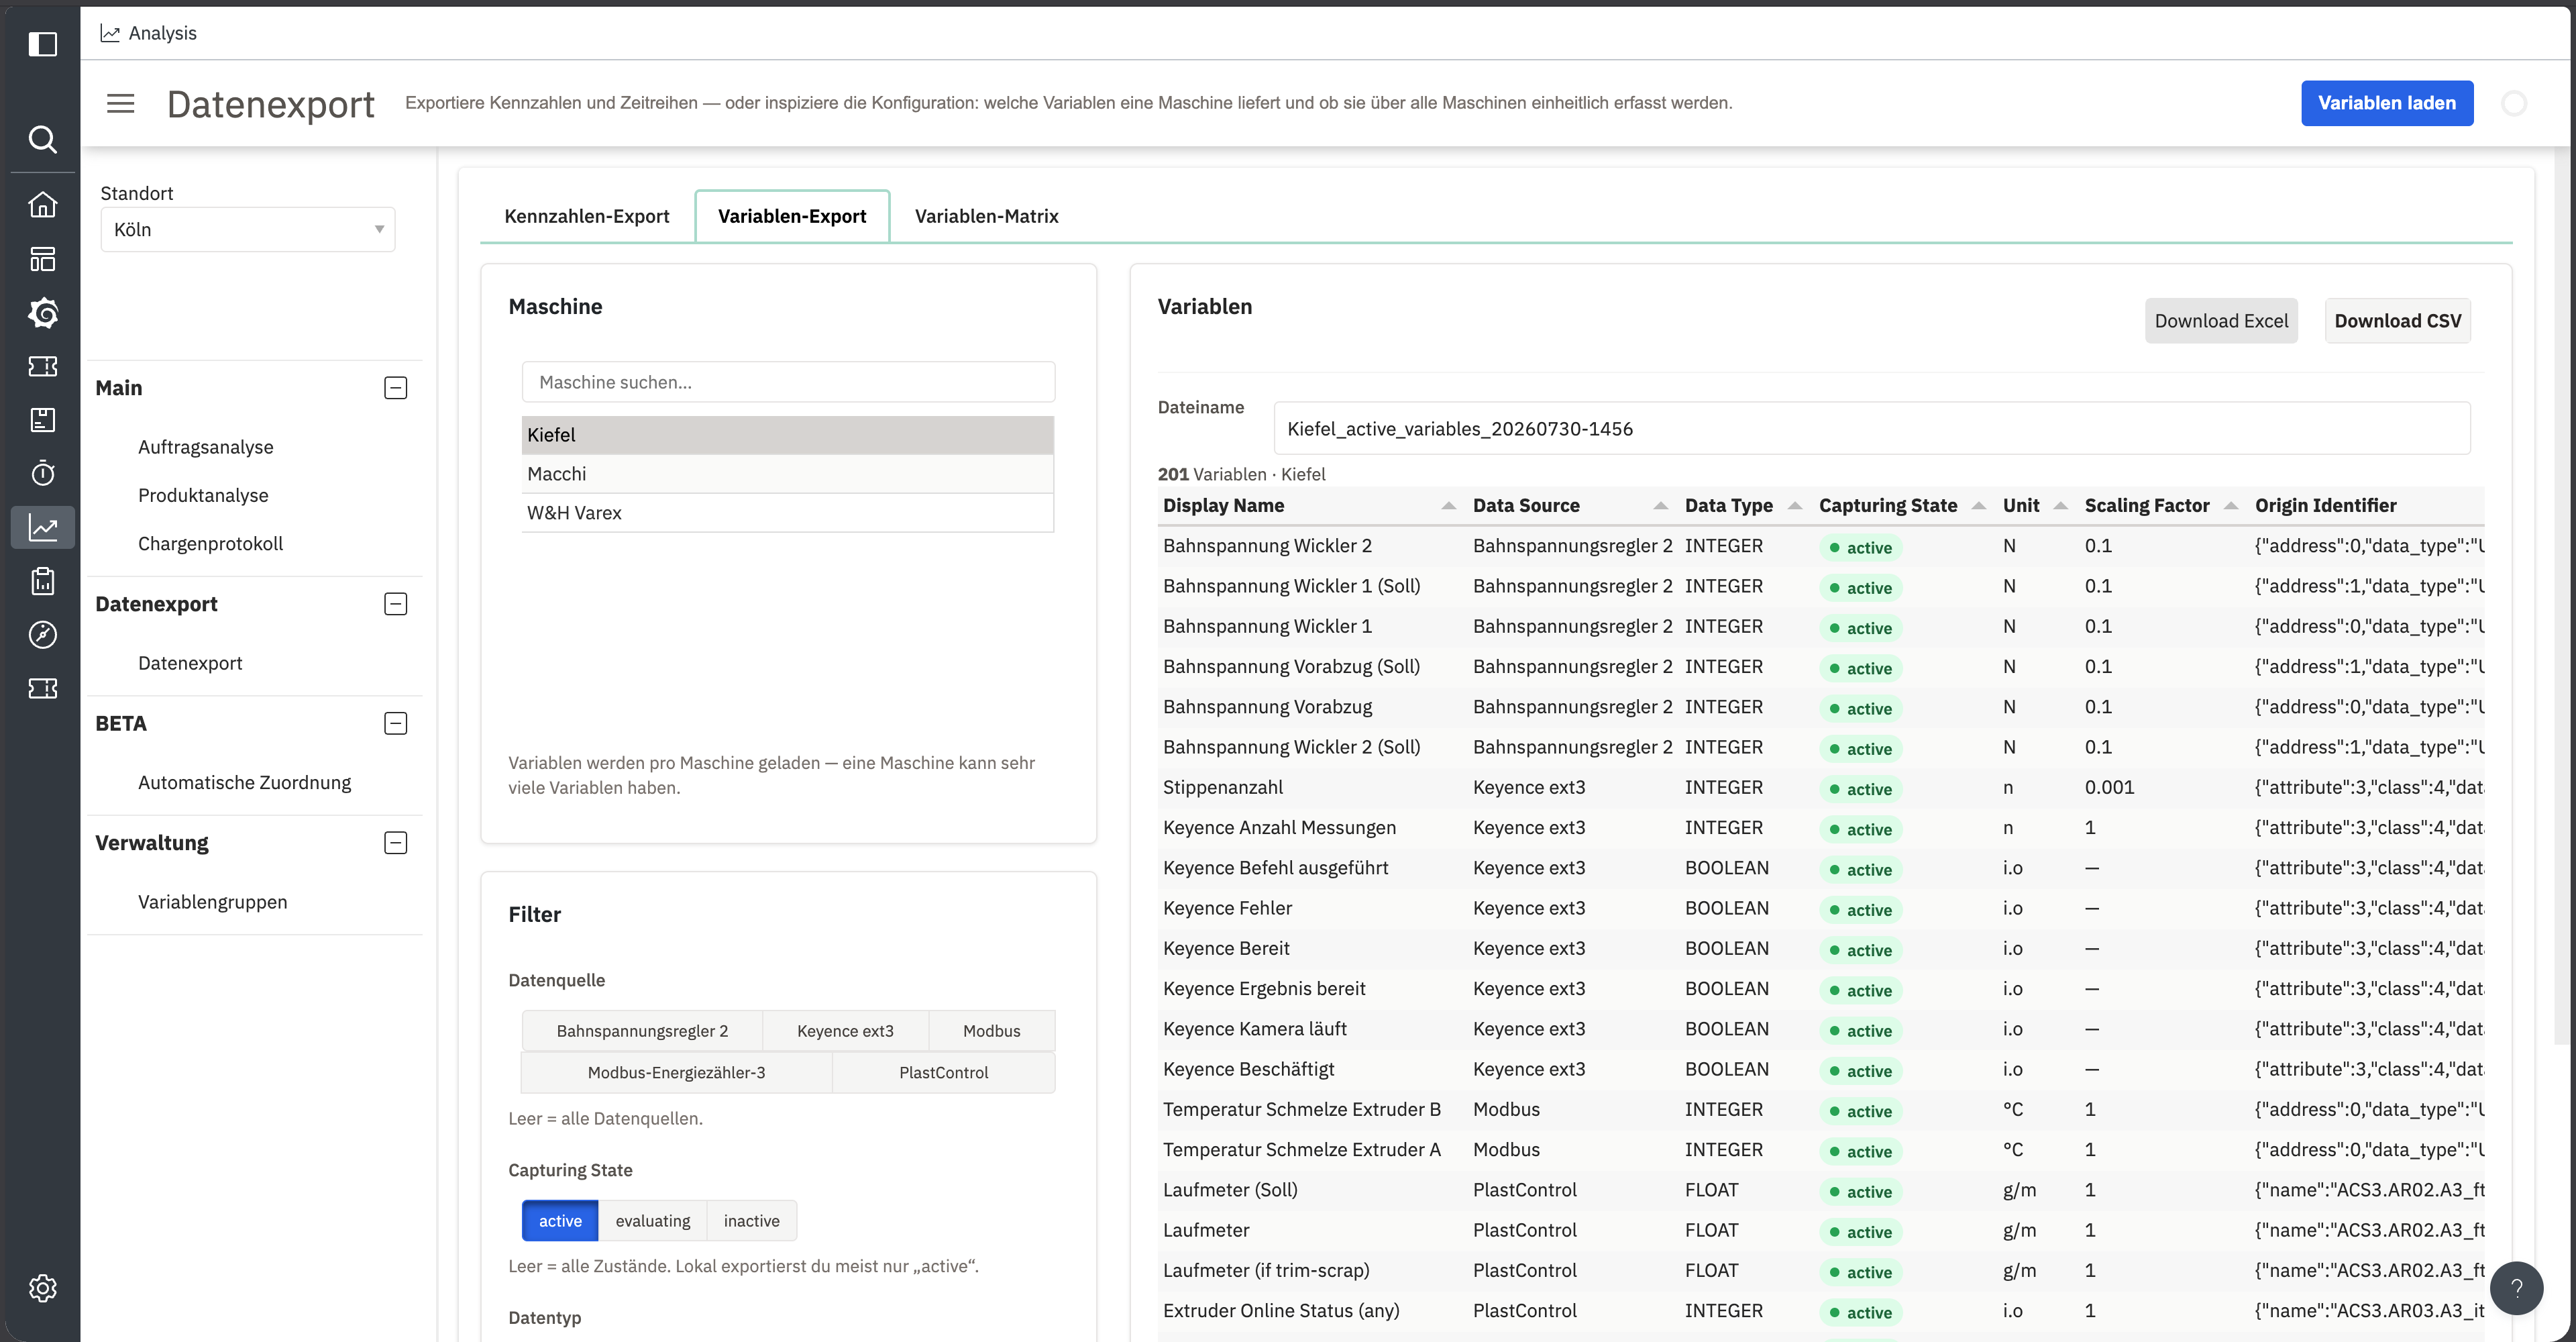
<figure><img src="https://4261006941-files.gitbook.io/~/files/v0/b/gitbook-x-prod.appspot.com/o/spaces%2FSNEuiyRRKwuqtIcaEt45%2Fuploads%2Fgit-blob-cfb5f67e604529306e0a54fbe0187fd4896f5918%2Fdashboards-datenexport-kennzahlen-01.png?alt=media" alt="Metrics export tab with export options, machine list and time range selection"><figcaption><p>Choose the export type, the machines and the time range, then load</p></figcaption></figure>

## Prerequisites

* Machines with active variables
* For run-based exports: booked production runs

## The three tabs

| Tab                 | Purpose                                               |
| ------------------- | ----------------------------------------------------- |
| **Metrics export**  | Aggregated metrics and downtimes across many machines |
| **Variable export** | A machine's variable configuration                    |
| **Variable matrix** | Check which machine delivers which variable           |

## Metrics export

Under **Export options** you pick exactly one export type:

**OEE metrics**

* **Time-based productivity**: metrics per time unit, independent of runs.
* **Production-run-based productivity**: metrics per production run.

**Downtimes**

* **Downtimes**: the detected downtimes in the range.
* **Downtimes with production-run context**: the same downtimes, plus the run that was active at the time.

Below that you select the **Machines**. The search field filters the list, **All** and **None** set or clear the whole selection. Above the list you see how many machines of how many are selected.

Under **Time Range** you set the **Unit** of aggregation, day for example, and choose the range. **Quick select** sets the last 7, 30 or 90 days.

Select **Load data**. The preview appears on the right, the download below it.

## Variable export

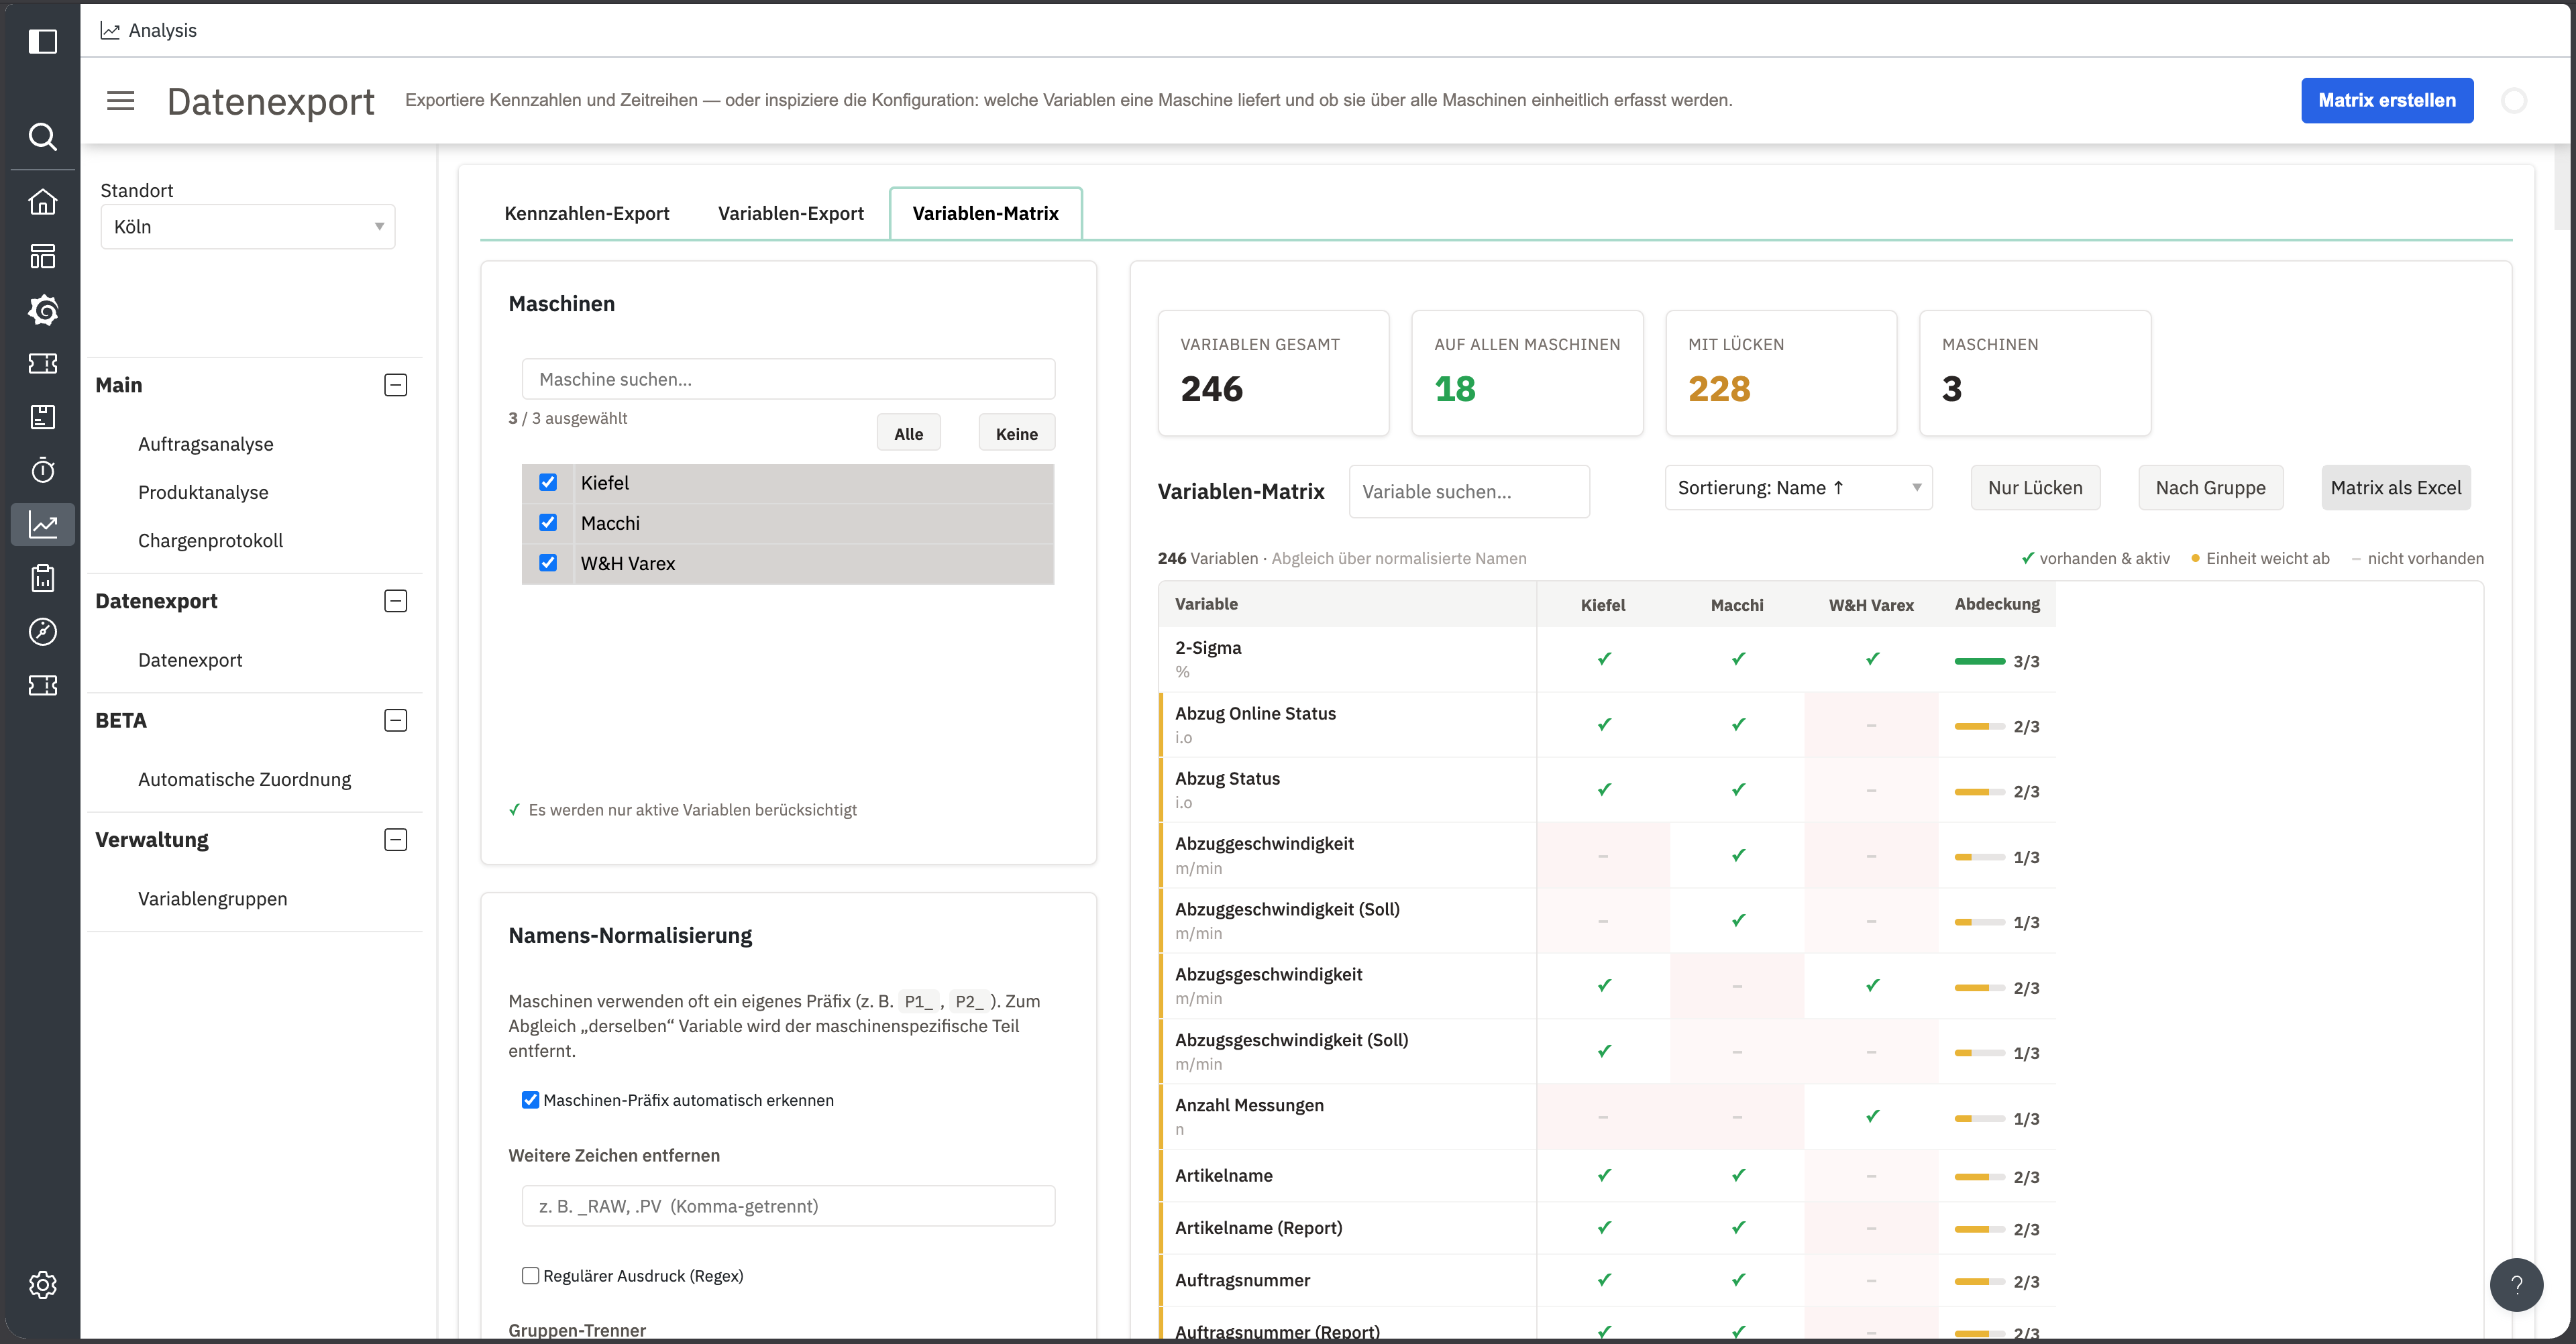
This tab does not export measurements. It exports a machine's variable **configuration**: which variables exist, which data source they come from, their data type and unit, and the scaling factor applied to their raw values.

<figure><img src="https://4261006941-files.gitbook.io/~/files/v0/b/gitbook-x-prod.appspot.com/o/spaces%2FSNEuiyRRKwuqtIcaEt45%2Fuploads%2Fgit-blob-4832e4c61f9435cb96c1b99cf1ae79b37d3c7b2a%2Fdashboards-datenexport-variablen-01.png?alt=media" alt="Variable export tab with machine selection, filters and a loaded variable table"><figcaption><p>A machine's variable configuration, loaded and ready to download</p></figcaption></figure>

Pick the **Machine** on the left. Under **Filter** you can narrow by:

* **Data source**: variables from one controller or sensor only. Empty means all data sources.
* **Capturing State**: `active`, `evaluating` or `inactive`. Empty means all states; for an export you usually want `active` only.
* **Data type**

Select **Load variables**. The table lists **Display Name**, **Data Source**, **Data Type**, **Capturing State**, **Unit**, **Scaling Factor**, **Origin Identifier**, **Origin Name** and **Comment** per variable. Name the file under **File name**, then use **Download Excel** or **Download CSV**.

Useful for taking stock: which variables exist on this machine, what they are called, and how their raw values are converted. A machine can have a great many variables, which is why only one machine is loaded at a time.

{% hint style="info" %}
This tab is not for measurements over time. For timeseries, use the CSV download in [Production run analysis](/en/production-optimization/analysis/production-run-analysis.md) or the [ENLYZE API](/en/enlyze-api/quickstart.md).
{% endhint %}

## Variable matrix

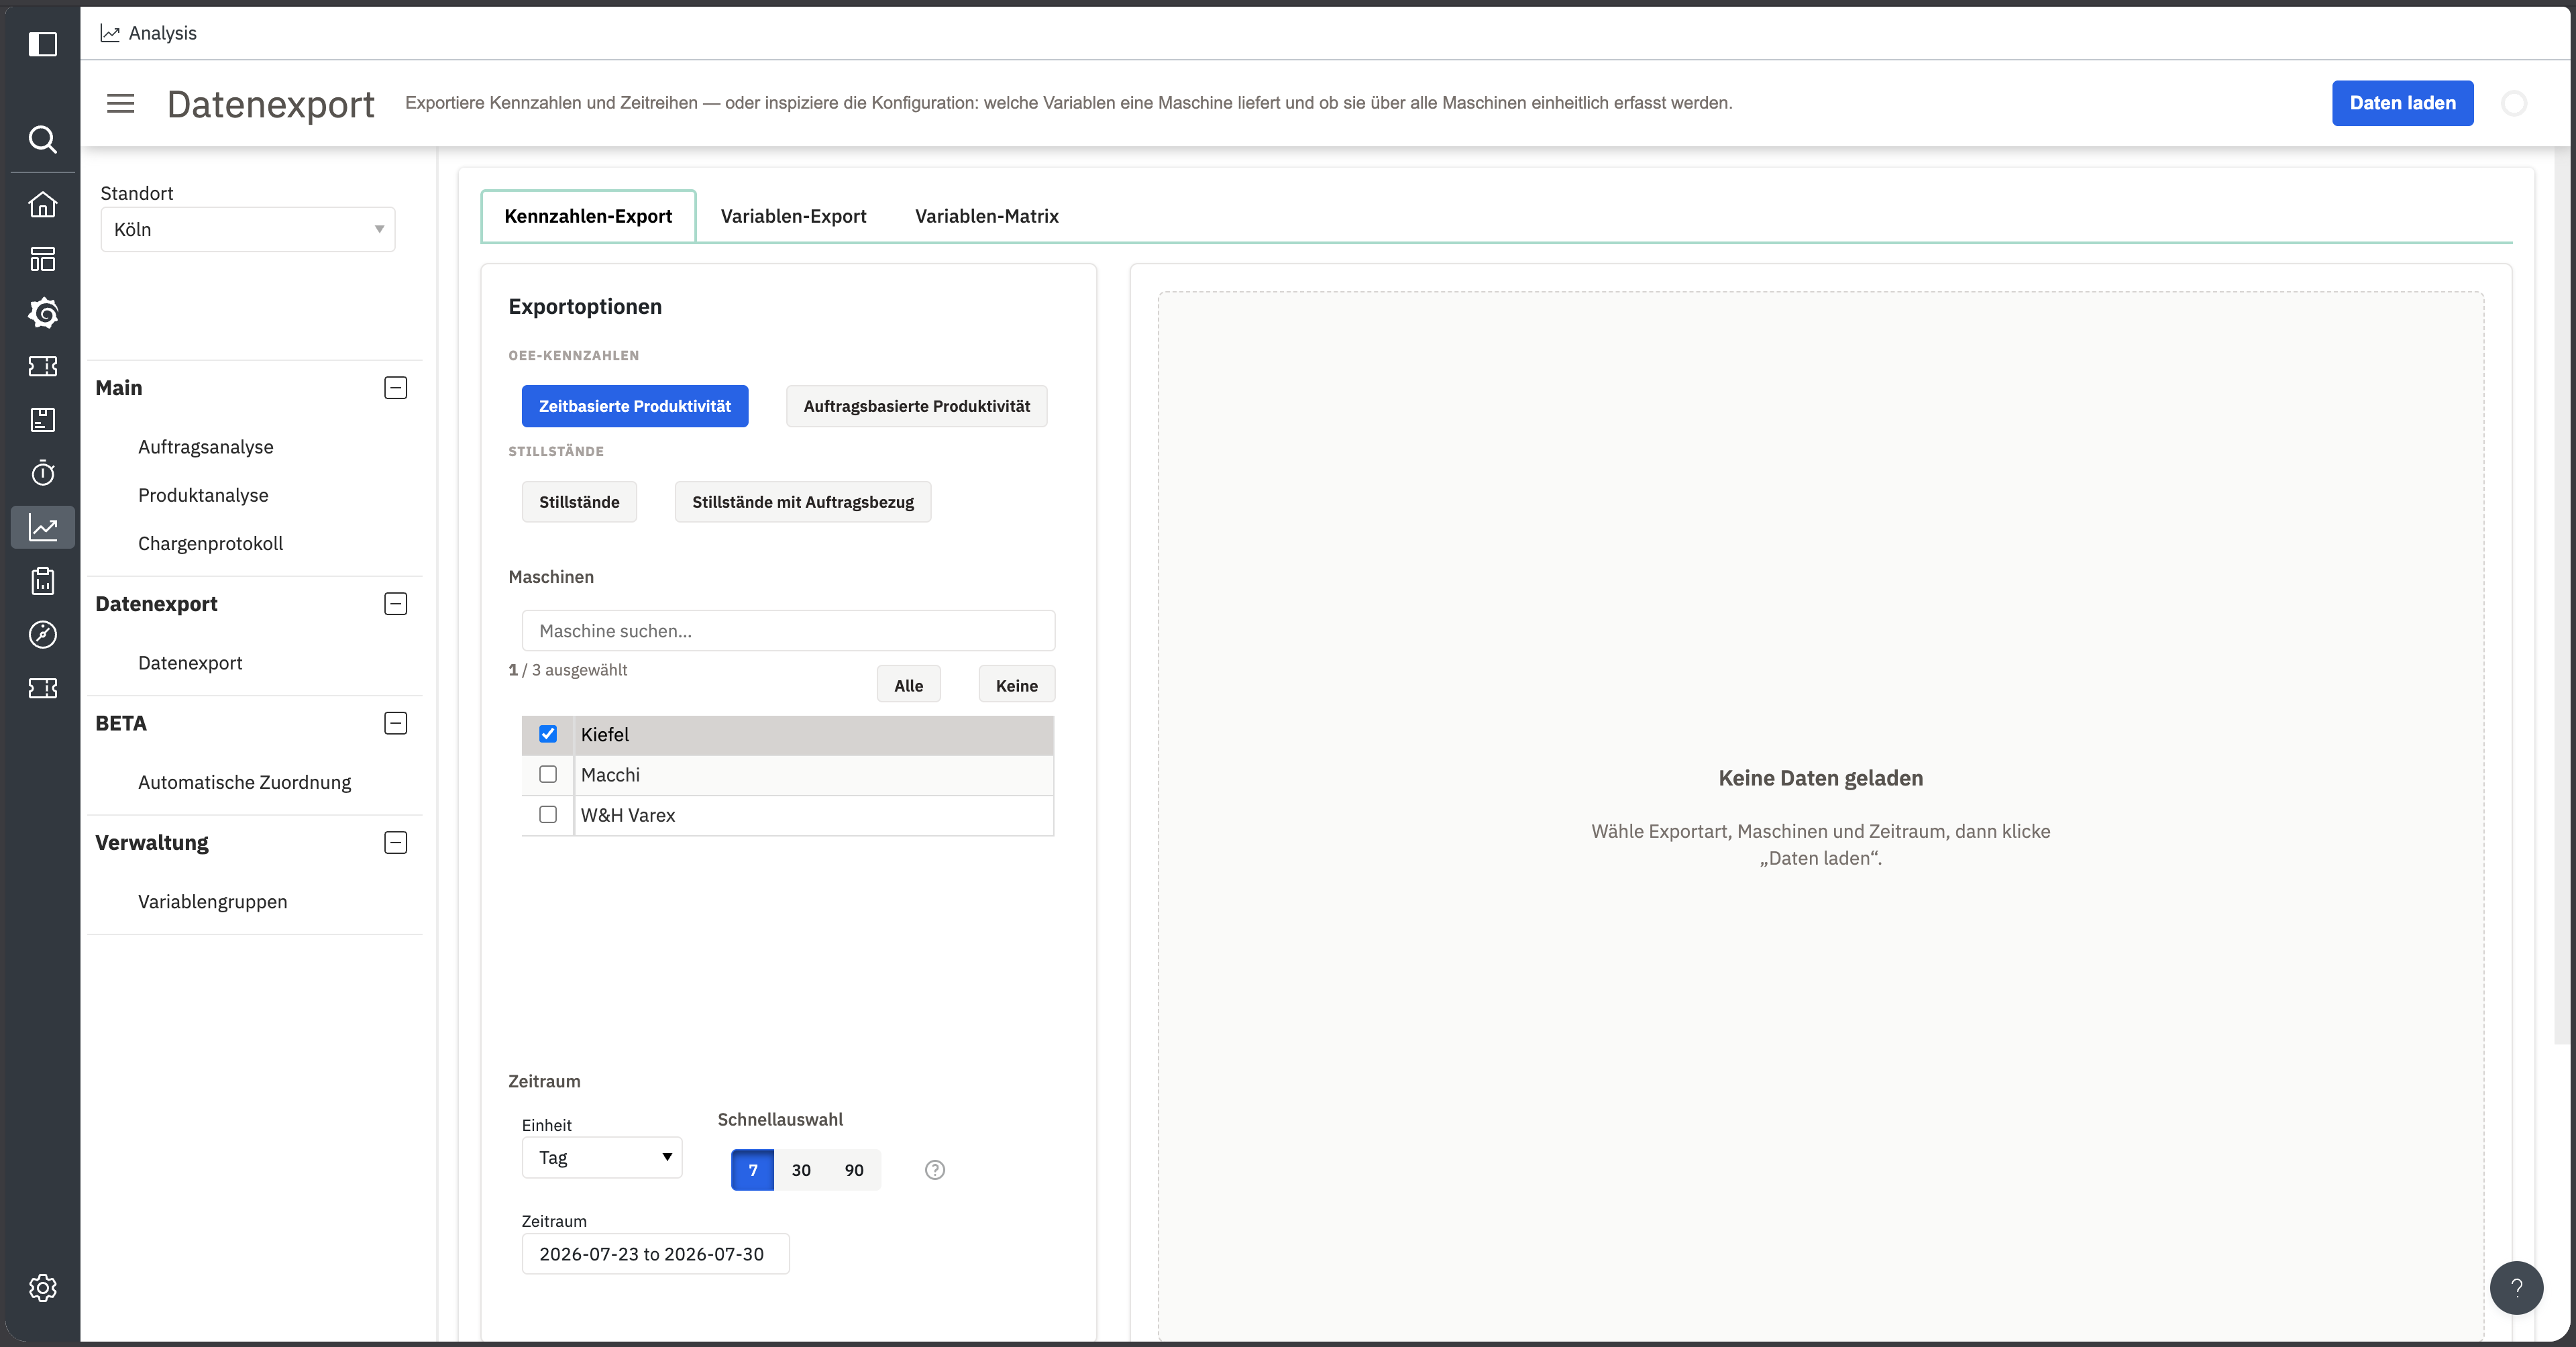
The matrix compares the variables of several machines and shows where one is missing or differs.

<figure><img src="https://4261006941-files.gitbook.io/~/files/v0/b/gitbook-x-prod.appspot.com/o/spaces%2FSNEuiyRRKwuqtIcaEt45%2Fuploads%2Fgit-blob-57194b4e07bf194eb0ad677a5701e79fa61a988d%2Fdashboards-datenexport-matrix-01.png?alt=media" alt="Variable matrix with summary tiles, name normalisation and a coverage column"><figcaption><p>246 variables across three machines, 18 of them present everywhere</p></figcaption></figure>

Select the **Machines** and choose **Create matrix**. Only active variables are considered.

### Name normalisation

Machines often use their own prefix, `P1_` and `P2_` for example. So that the same variable is recognised as the same across machines, normalisation strips the machine-specific part of the name:

* **Detect machine prefix automatically** is on by default
* **Remove further characters** for suffixes such as `_RAW` or `.PV`, comma separated
* **Regular expression (Regex)** for patterns a character list cannot express
* **Group separator** to group by part of the name

Without suitable normalisation, every machine's variant shows up as its own row and the matrix reports gaps everywhere there are none.

### Reading the result

Four tiles summarise: total variables, how many are on all machines, how many have gaps, and the number of machines.

The table gives one column per machine plus a **Coverage** column:

| Symbol | Meaning                       |
| ------ | ----------------------------- |
| ✓      | present and active            |
| ●      | present, but the unit differs |
| –      | not present                   |

{% hint style="warning" %}
**Unit differs** is the quietest and most dangerous case. The variable exists on every machine, but one reports a different unit. Aggregations across machines come out wrong even though nothing is missing.
{% endhint %}

**Gaps only** filters to the incomplete variables, **By group** groups by name component, **Matrix as Excel** exports the result.

## File formats

CSV and Excel (`.xlsx`). Excel suits handing a file to someone directly, CSV suits further processing in scripts or BI tools.

## Known limitations

{% hint style="info" %}
In the productivity exports, the quantity unit currently sits in the column header rather than a column of its own. Account for that when parsing the header row programmatically.
{% endhint %}

## Common questions

<details>

<summary>What is the difference between time-based and run-based productivity?</summary>

The time-based variant slices the timeline into equal units, days for example, and calculates per unit. The run-based variant calculates per production run, however long it lasted. Use time-based for shift or day comparisons, run-based for costing a run after the fact.

</details>

<details>

<summary>Can I automate exports?</summary>

Not from this dashboard. For recurring or programmatic queries, use the [ENLYZE API](/en/enlyze-api/quickstart.md) or the [Power BI connector](/en/integrations/power-bi.md).

</details>

<details>

<summary>Why is a variable empty in the matrix?</summary>

The variable is not active on that machine. Activate it via [Contextualisation](/en/variable-mapping/contextualisation.md).

</details>

## Related topics

* [ENLYZE API](/en/enlyze-api/quickstart.md) for automated queries.
* [Power BI](/en/integrations/power-bi.md) and [Grafana](/en/integrations/grafana.md) for ongoing analysis rather than one-off exports.