> For the complete documentation index, see [llms.txt](https://docs.enlyze.com/llms.txt). Markdown versions of documentation pages are available by appending `.md` to page URLs; this page is available as [Markdown](https://docs.enlyze.com/en/production-optimization/downtimes/assigning-reasons.md).
# Assign reasons to downtimes
Assign reasons to detected downtime events.
Once a downtime is detected, a reason can be assigned to it. This is what makes it possible to analyze downtime causes and reduce them systematically.
{% hint style="info" %}
What the three downtime categories (Planned, Unplanned, No Production Planned) mean and why assignment matters is explained under [Categories & assignment (Concepts)](/en/concepts/downtimes/categories-and-assignment.md).
{% endhint %}
## Prerequisites
Before you start, ensure that:
* **Downtime detection** is configured for the relevant machine :arrow\_right: [OEE](/en/production-optimization/oee.md#configuring-downtime-detection)
* **Downtime reasons** have been defined in your ENLYZE configuration :arrow\_right: [Build the downtime catalog](/en/production-optimization/downtimes/defining-reasons.md)
## Open the downtime editor
Reasons are assigned through the ENLYZE App: [app.enlyze.com](https://app.enlyze.com). You can reach the downtime editor in two ways:
1. **Production Overview Panel.** It is located on the app's home page and shows downtimes per machine for the selected time range.
2. **Downtime Section.** Provides the complete list of downtimes across all machines. Use the dropdown in the upper-left corner to filter by machine.
Click the downtime entry you want to edit to open the editor.
## Assign a reason
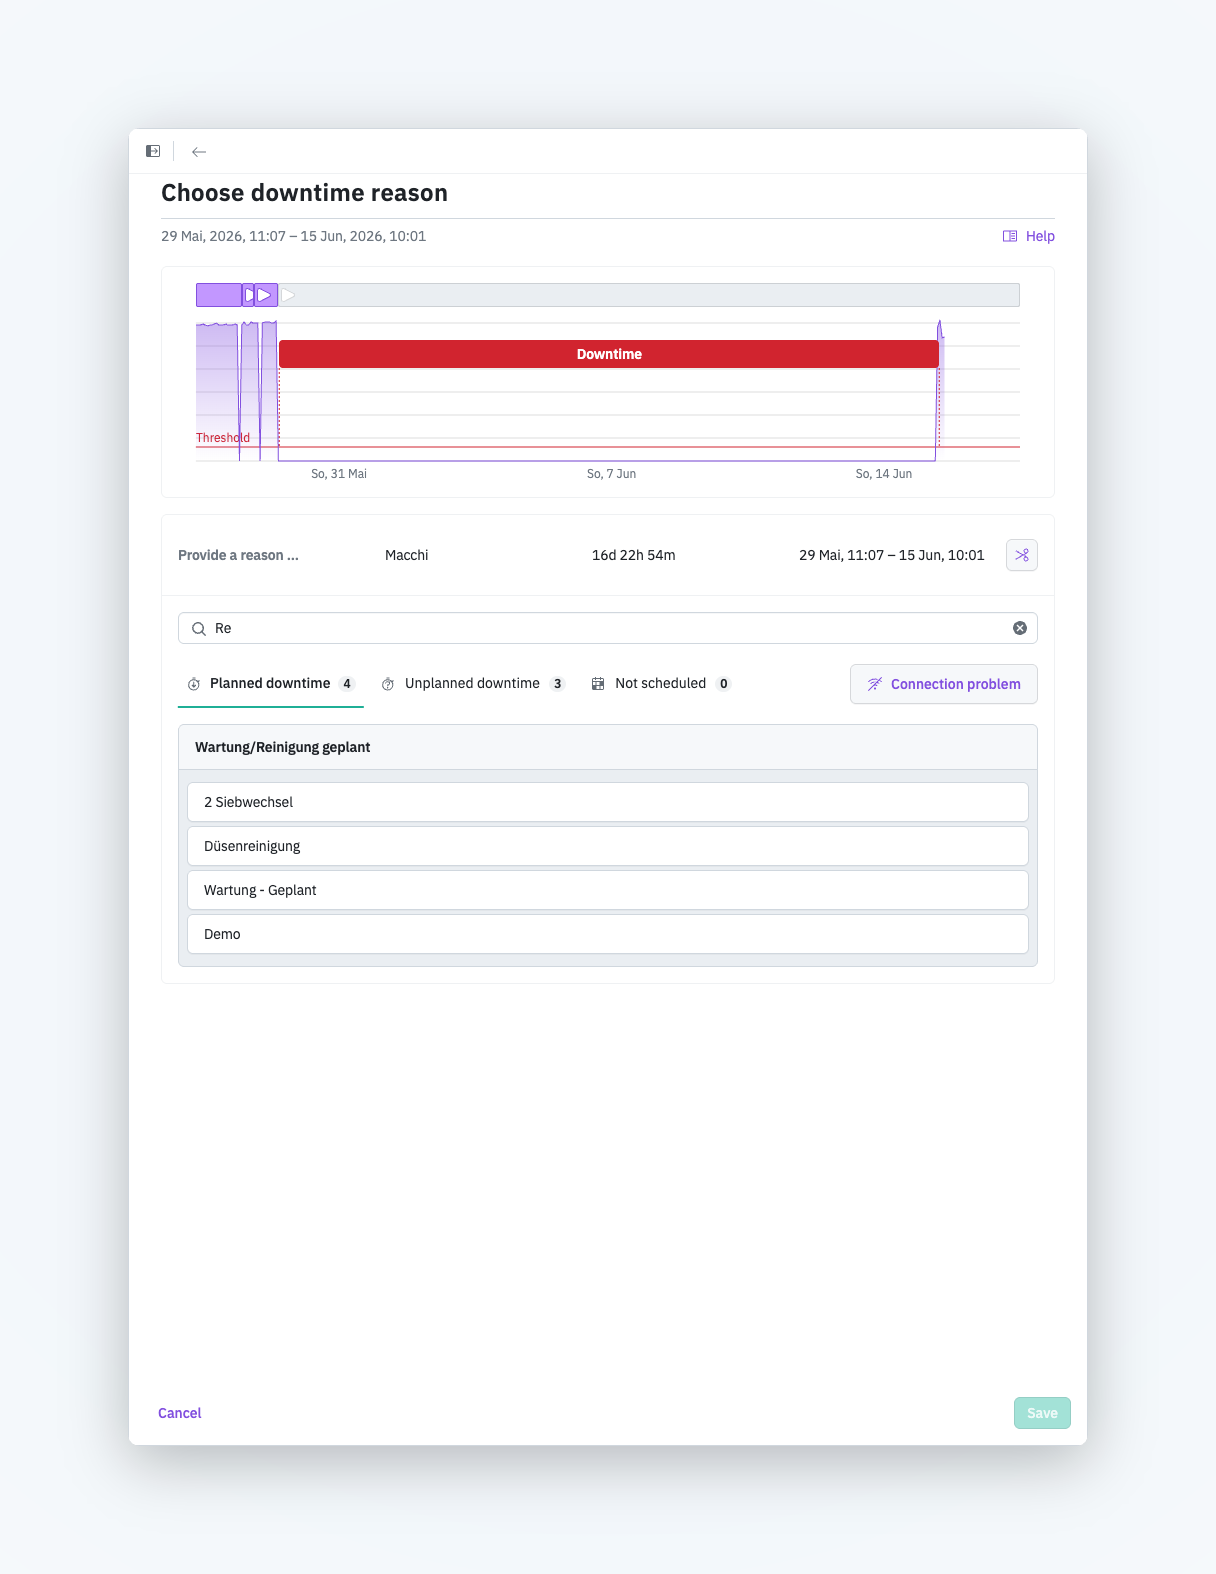
The editor shows the selected downtime and the catalogue of all downtime reasons:
* Predefined reasons are organized into **categories** (Planned, Unplanned, No Production Planned) and, below them, into **groups**. Switch categories using the tabs above the list. Reasons without a group appear under **Other reasons**.
* Click a reason to assign it directly to the downtime.
* Use the **Connection problem** button to mark a downtime caused by an interrupted data connection.
* Optionally, add a comment for clarification.
* Click **Save** (bottom right) to apply your changes.
* Click **Cancel** (bottom left) to discard your changes and restore the previous state.
### Finding a reason with search
When many downtime reasons are configured, the fastest way to find the right one is the search field above the list. It is active as soon as the editor opens, so you can start typing right away.
* Search matches the **downtime reasons** and the **group name** and is case-insensitive.
* The list filters live. Each category tab shows the number of matches it contains.
* If the current category has no match, ENLYZE shows a notice. When other categories contain matches, they are listed with their match count so you can switch directly.
* Clear the search field with the **X** inside it or with the **Esc** key.
## Split a downtime
To split a downtime into multiple parts:
1. Click the **scissors icon** below the downtime plot .
2. Define the time intervals.
3. Assign a reason to each segment individually.
Once a reason is assigned, the information becomes available in the **ENLYZE Manufacturing Data Platform**. This means it can be used by any connected service or application for reporting, analysis, or optimization.


 .
2. Define the time intervals.
3. Assign a reason to each segment individually.
.
2. Define the time intervals.
3. Assign a reason to each segment individually.
