# 03 Stillstandsauswertung
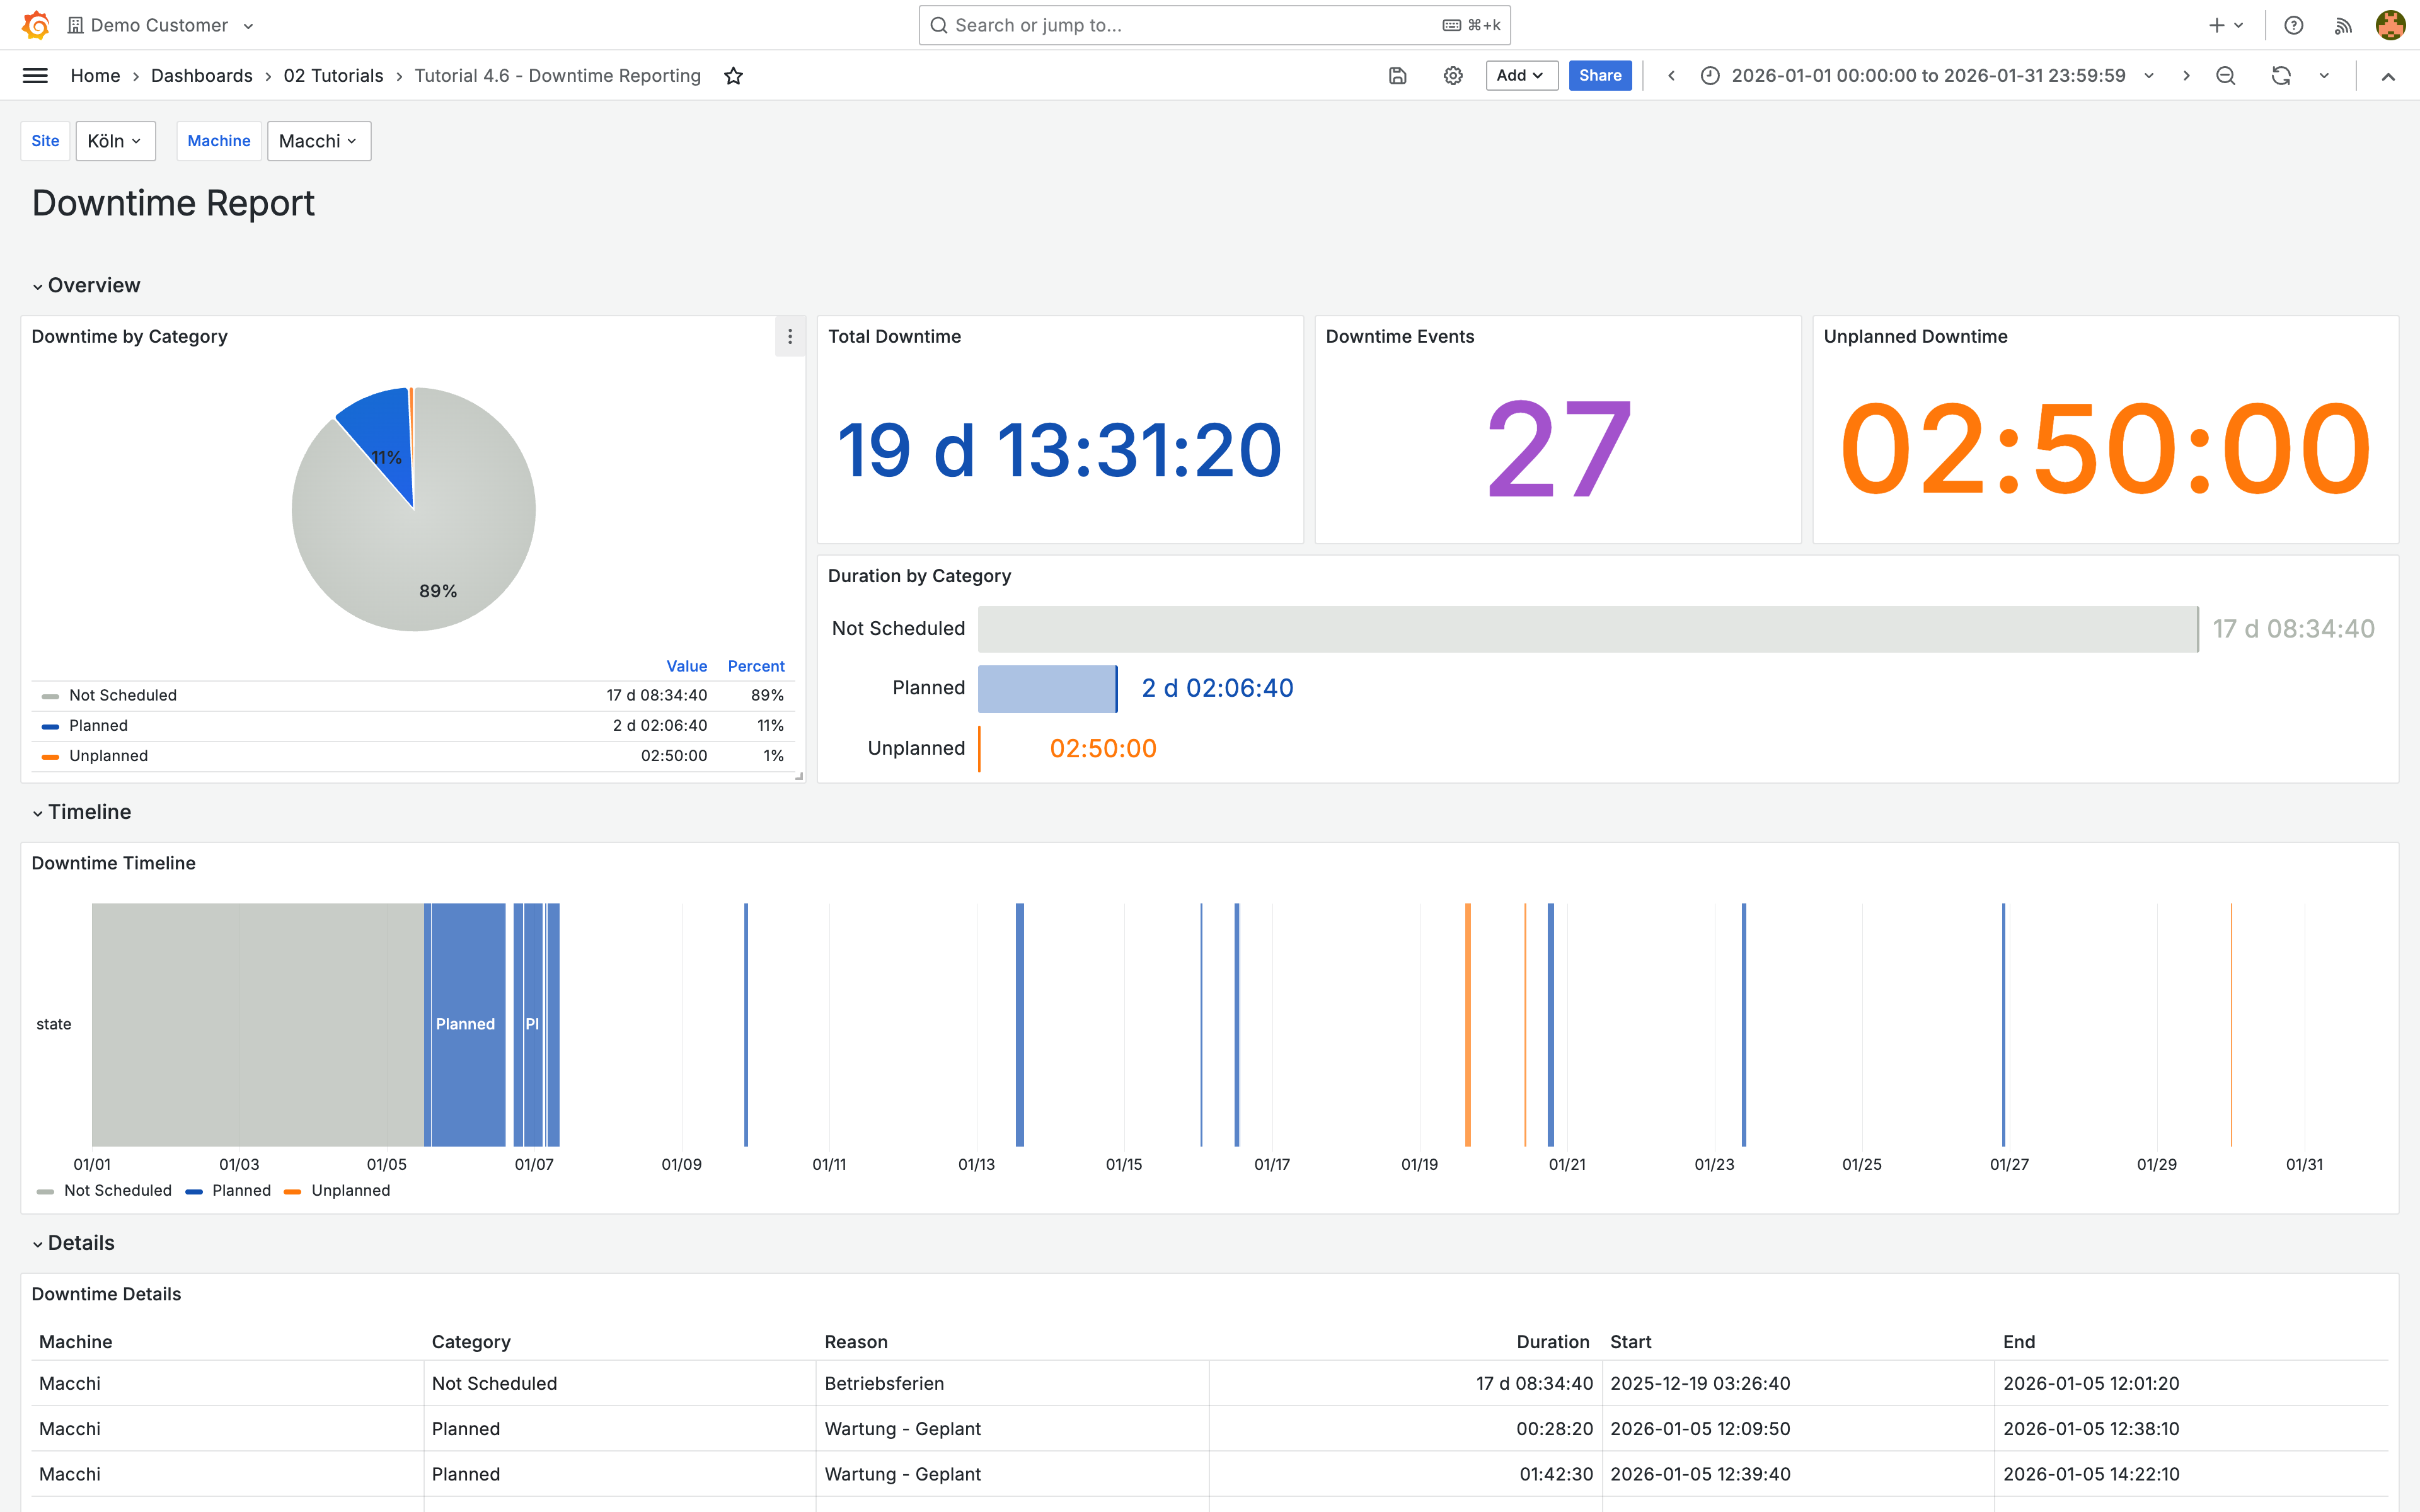
In diesem Tutorial erstellst du ein Dashboard zur Analyse von Maschinenstillständen mit Kreisdiagramm, Zeitstrahl und Detailtabelle:
## Was du lernst
* Den downtimes-API-Endpoint abfragen
* Stillstandsdauer mit Transformationen berechnen
* Stillstände mit Kreisdiagramm, Bar Gauge und State Timeline visualisieren
* Value Mappings für Stillstandskategorien einrichten
## Voraussetzungen
* [ENLYZE API abfragen](https://docs.enlyze.com/integrations/grafana/advanced-api/02-api-queries) und [Variablen](https://docs.enlyze.com/integrations/grafana/advanced-api/03-variables) abgeschlossen
* Verständnis von Infinity-Queries und Transformationen
***
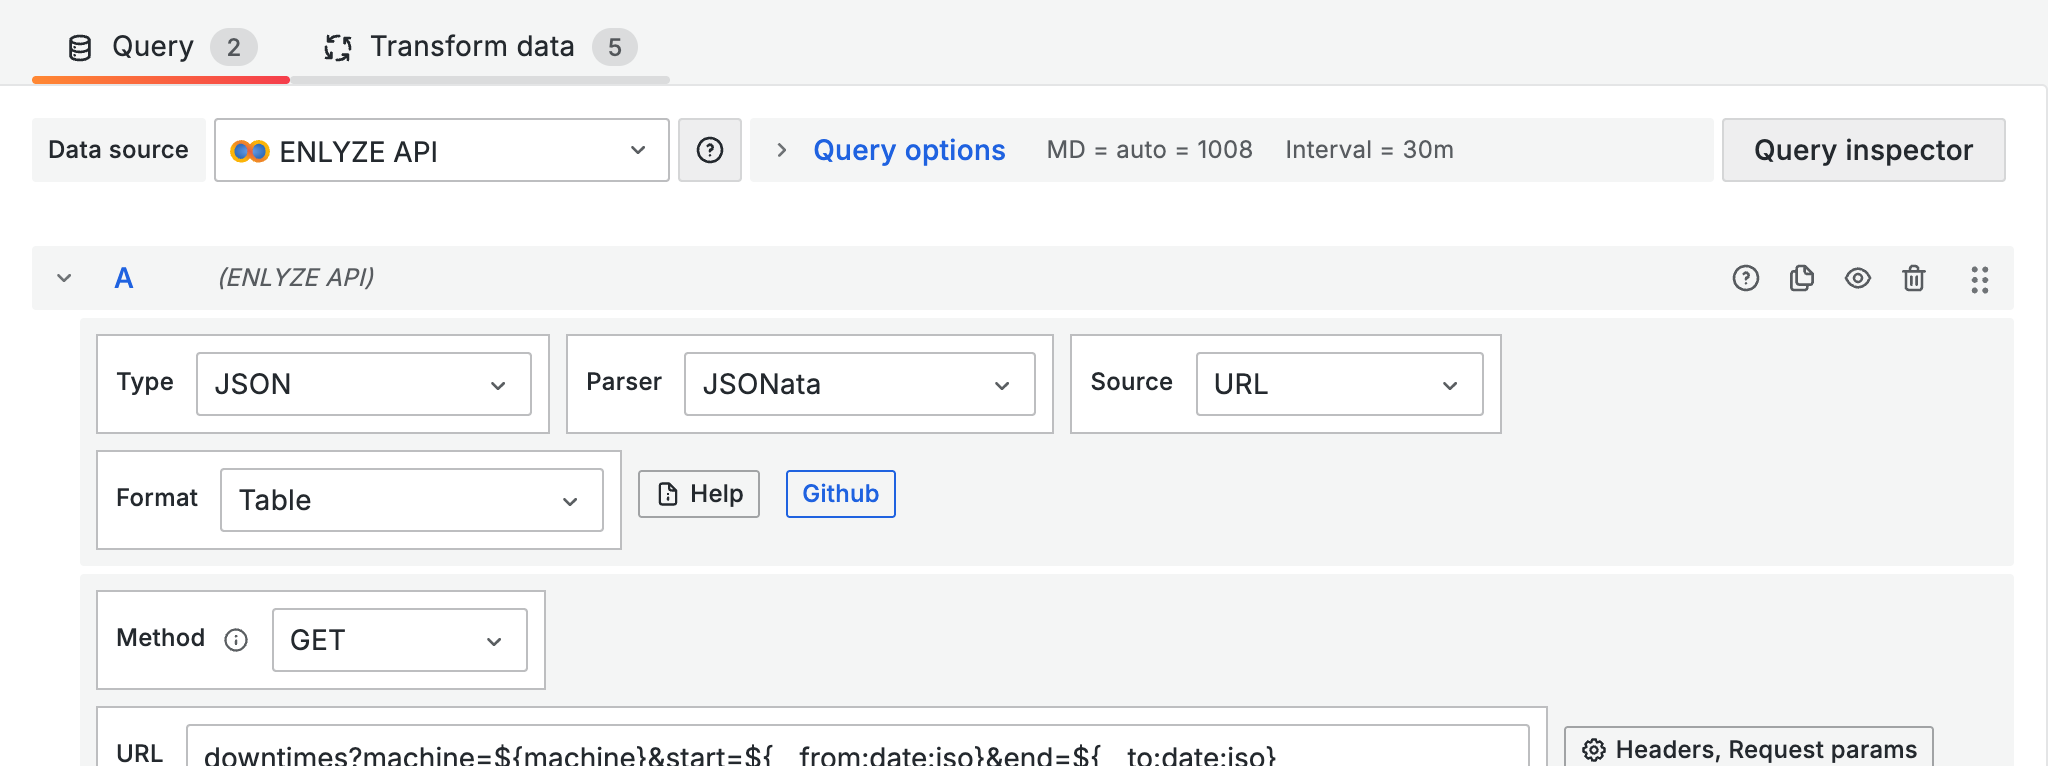
## Stillstände abfragen
| Einstellung | Wert |
| ------------- | ---------------------------------------------------------------------------- |
| Type | JSON |
| Parser | Backend |
| Method | GET |
| URL | `downtimes?machine=${machine}&start=${__from:date:iso}&end=${__to:date:iso}` |
| Root selector | siehe JSONata |
Die API liefert Stillstände mit verschachtelter Grund-Information. Verwende JSONata, um die Felder zu extrahieren und fehlende Endzeiten aufzufüllen:
```
$.data.{
"start": start,
"end": end ? end : $now(),
"category": reason.category ? reason.category : "UNKNOWN",
"reason": reason.name
}
```
{% hint style="info" %}
Wenn `end` den Wert `null` hat, ist der Stillstand noch aktiv. `$now()` ersetzt fehlende Endzeiten durch den aktuellen Zeitpunkt.
{% endhint %}
***
## Stillstandsdauer berechnen
Die Dauer lässt sich mit Transformationen aus Start- und Endzeit berechnen:
1. **Convert field type**: start und end → Time
2. **Add field from calculation**: Mode Binary, end - start → `duration_ms`
3. **Add field from calculation**: duration\_ms / 1000 → `duration`
Setze die Unit des `duration`-Felds auf **Duration (d hh:mm:ss)** (`dtdhms`).
***
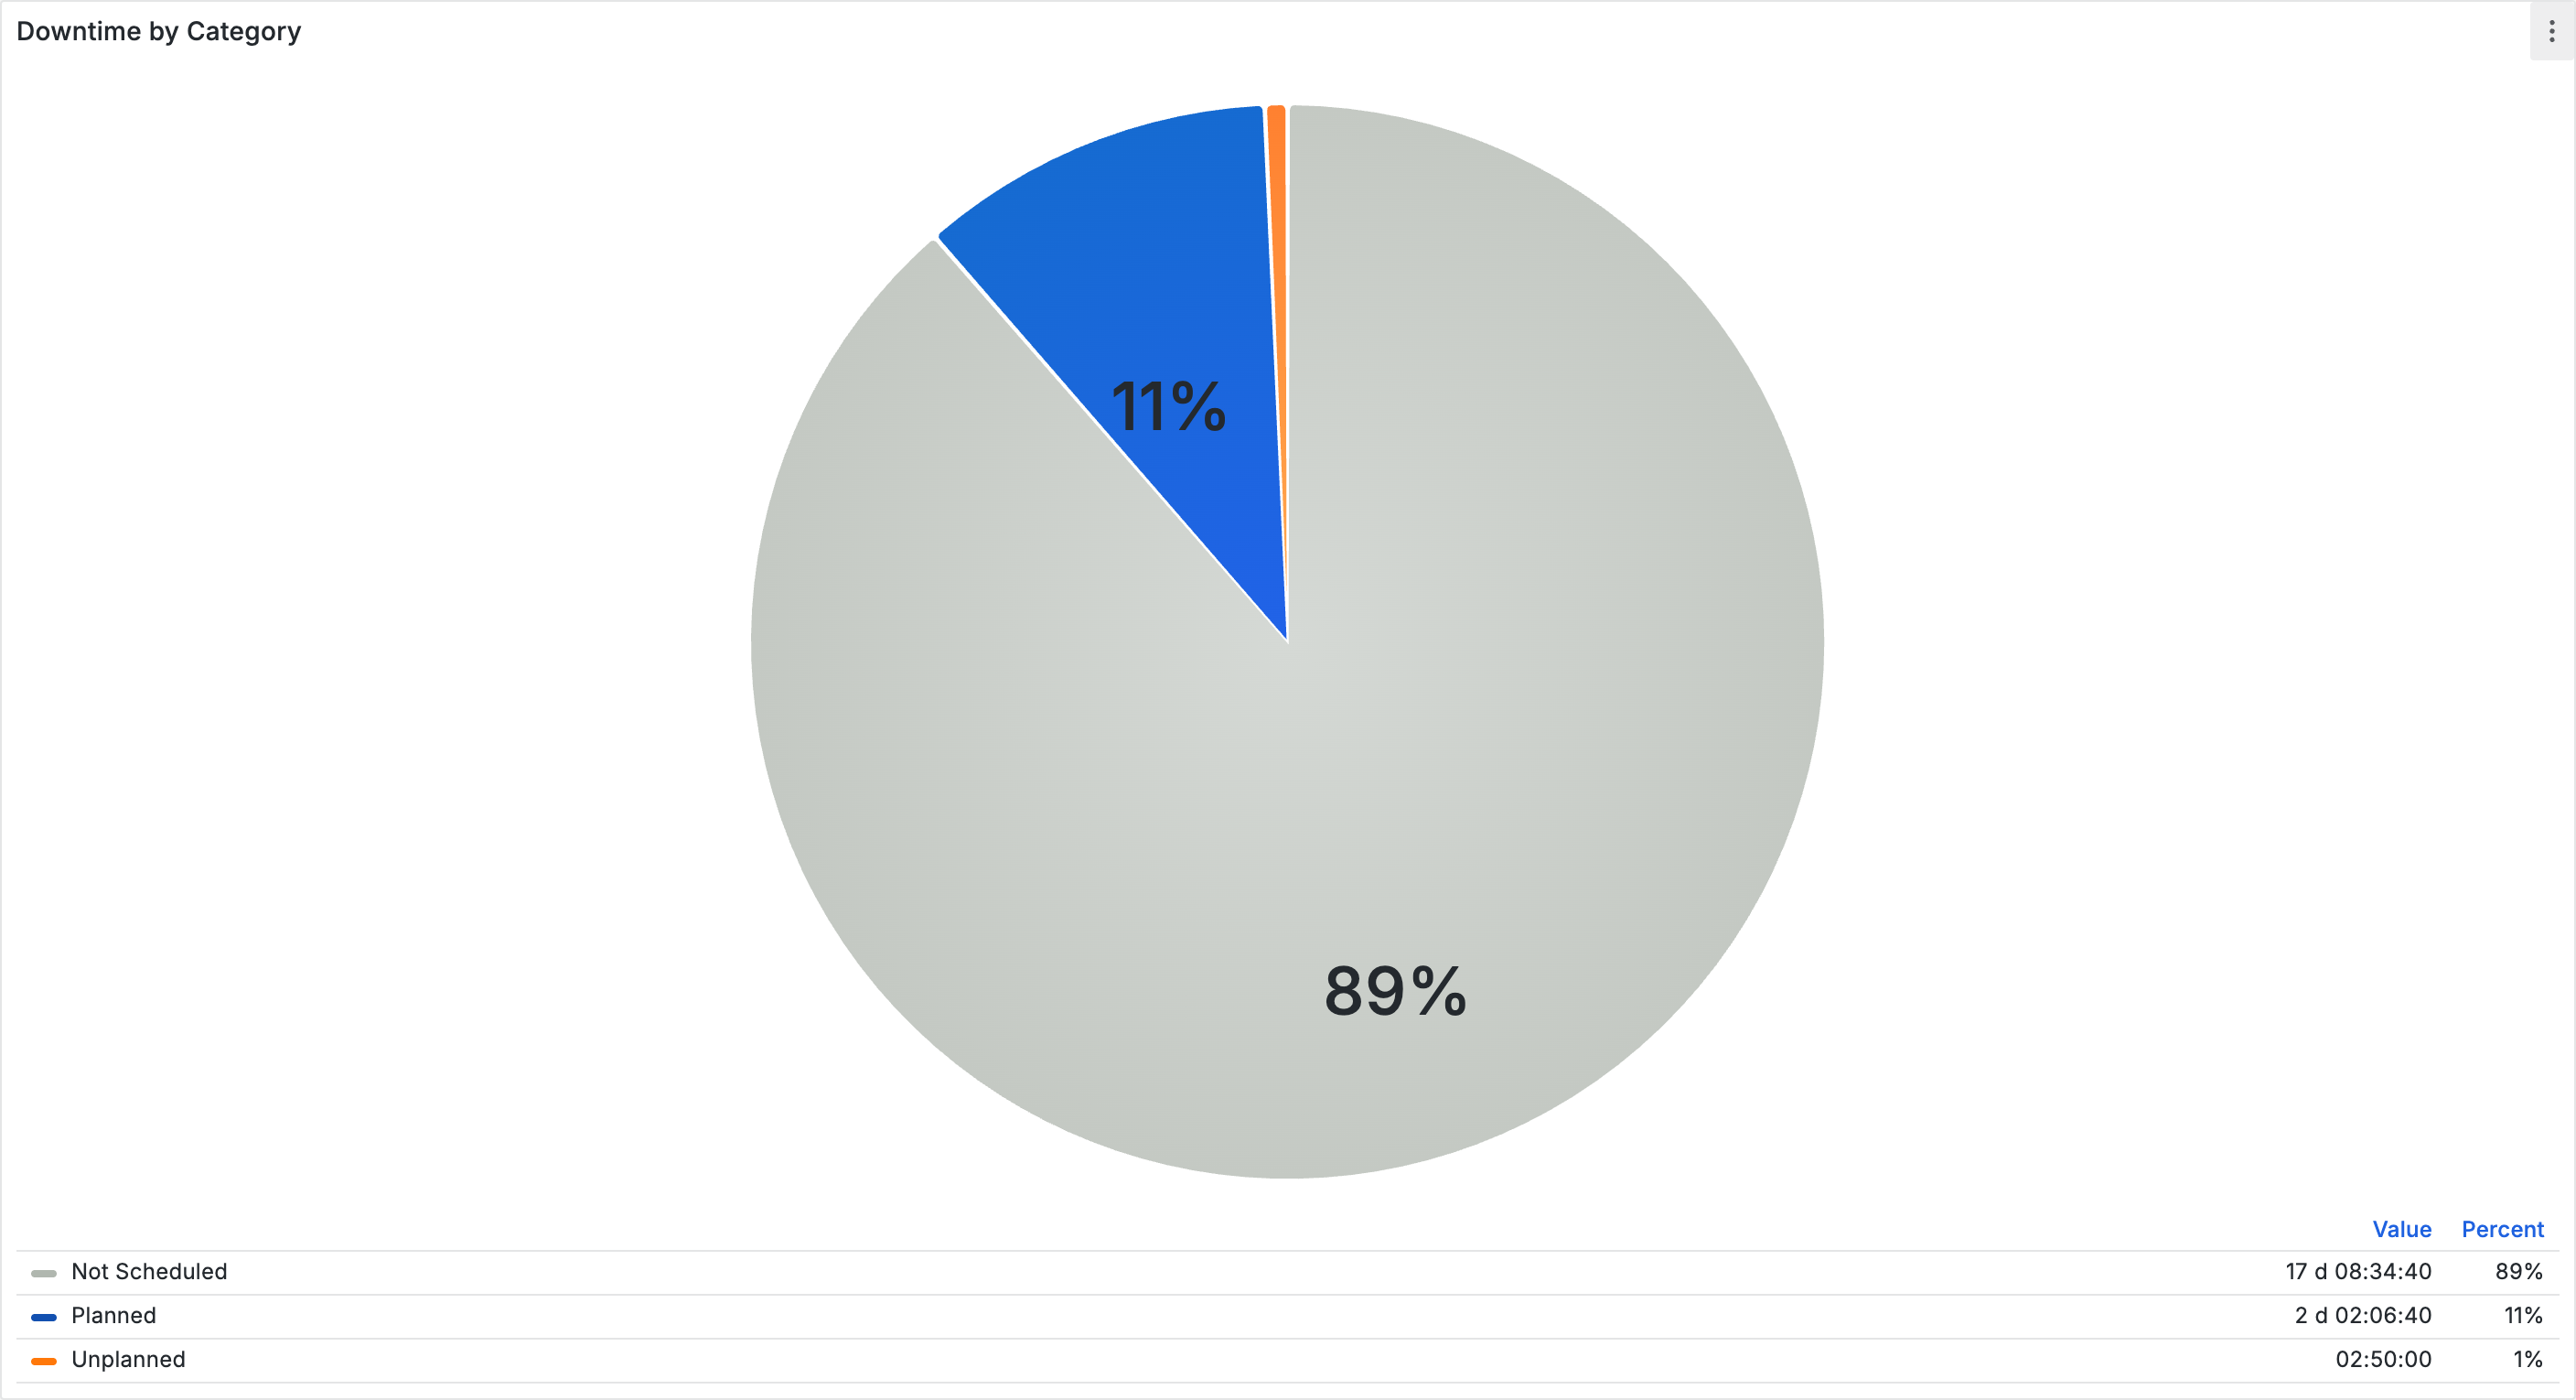
## Kreisdiagramm nach Kategorie
Visualisiere die Verteilung der Stillstandskategorien:
1. Verwende die Basis-Query mit den Transformationen zur Dauerberechnung
2. Füge eine **Group by**-Transformation hinzu: Group by `category`, Aggregate `duration` → Sum
3. Wähle die Visualisierung **Pie Chart**
Richte **Value Mappings** ein, um die API-Werte lesbar zu machen:
| API-Wert | Anzeige | Farbe |
| -------------- | -------------------- | ------ |
| PLANNED | Geplanter Stillstand | Blau |
| UNPLANNED | Ungeplant (manuell) | Orange |
| NOT\_SCHEDULED | Nicht eingeplant | Grau |
| UNKNOWN | Kein Grund | Gelb |
***
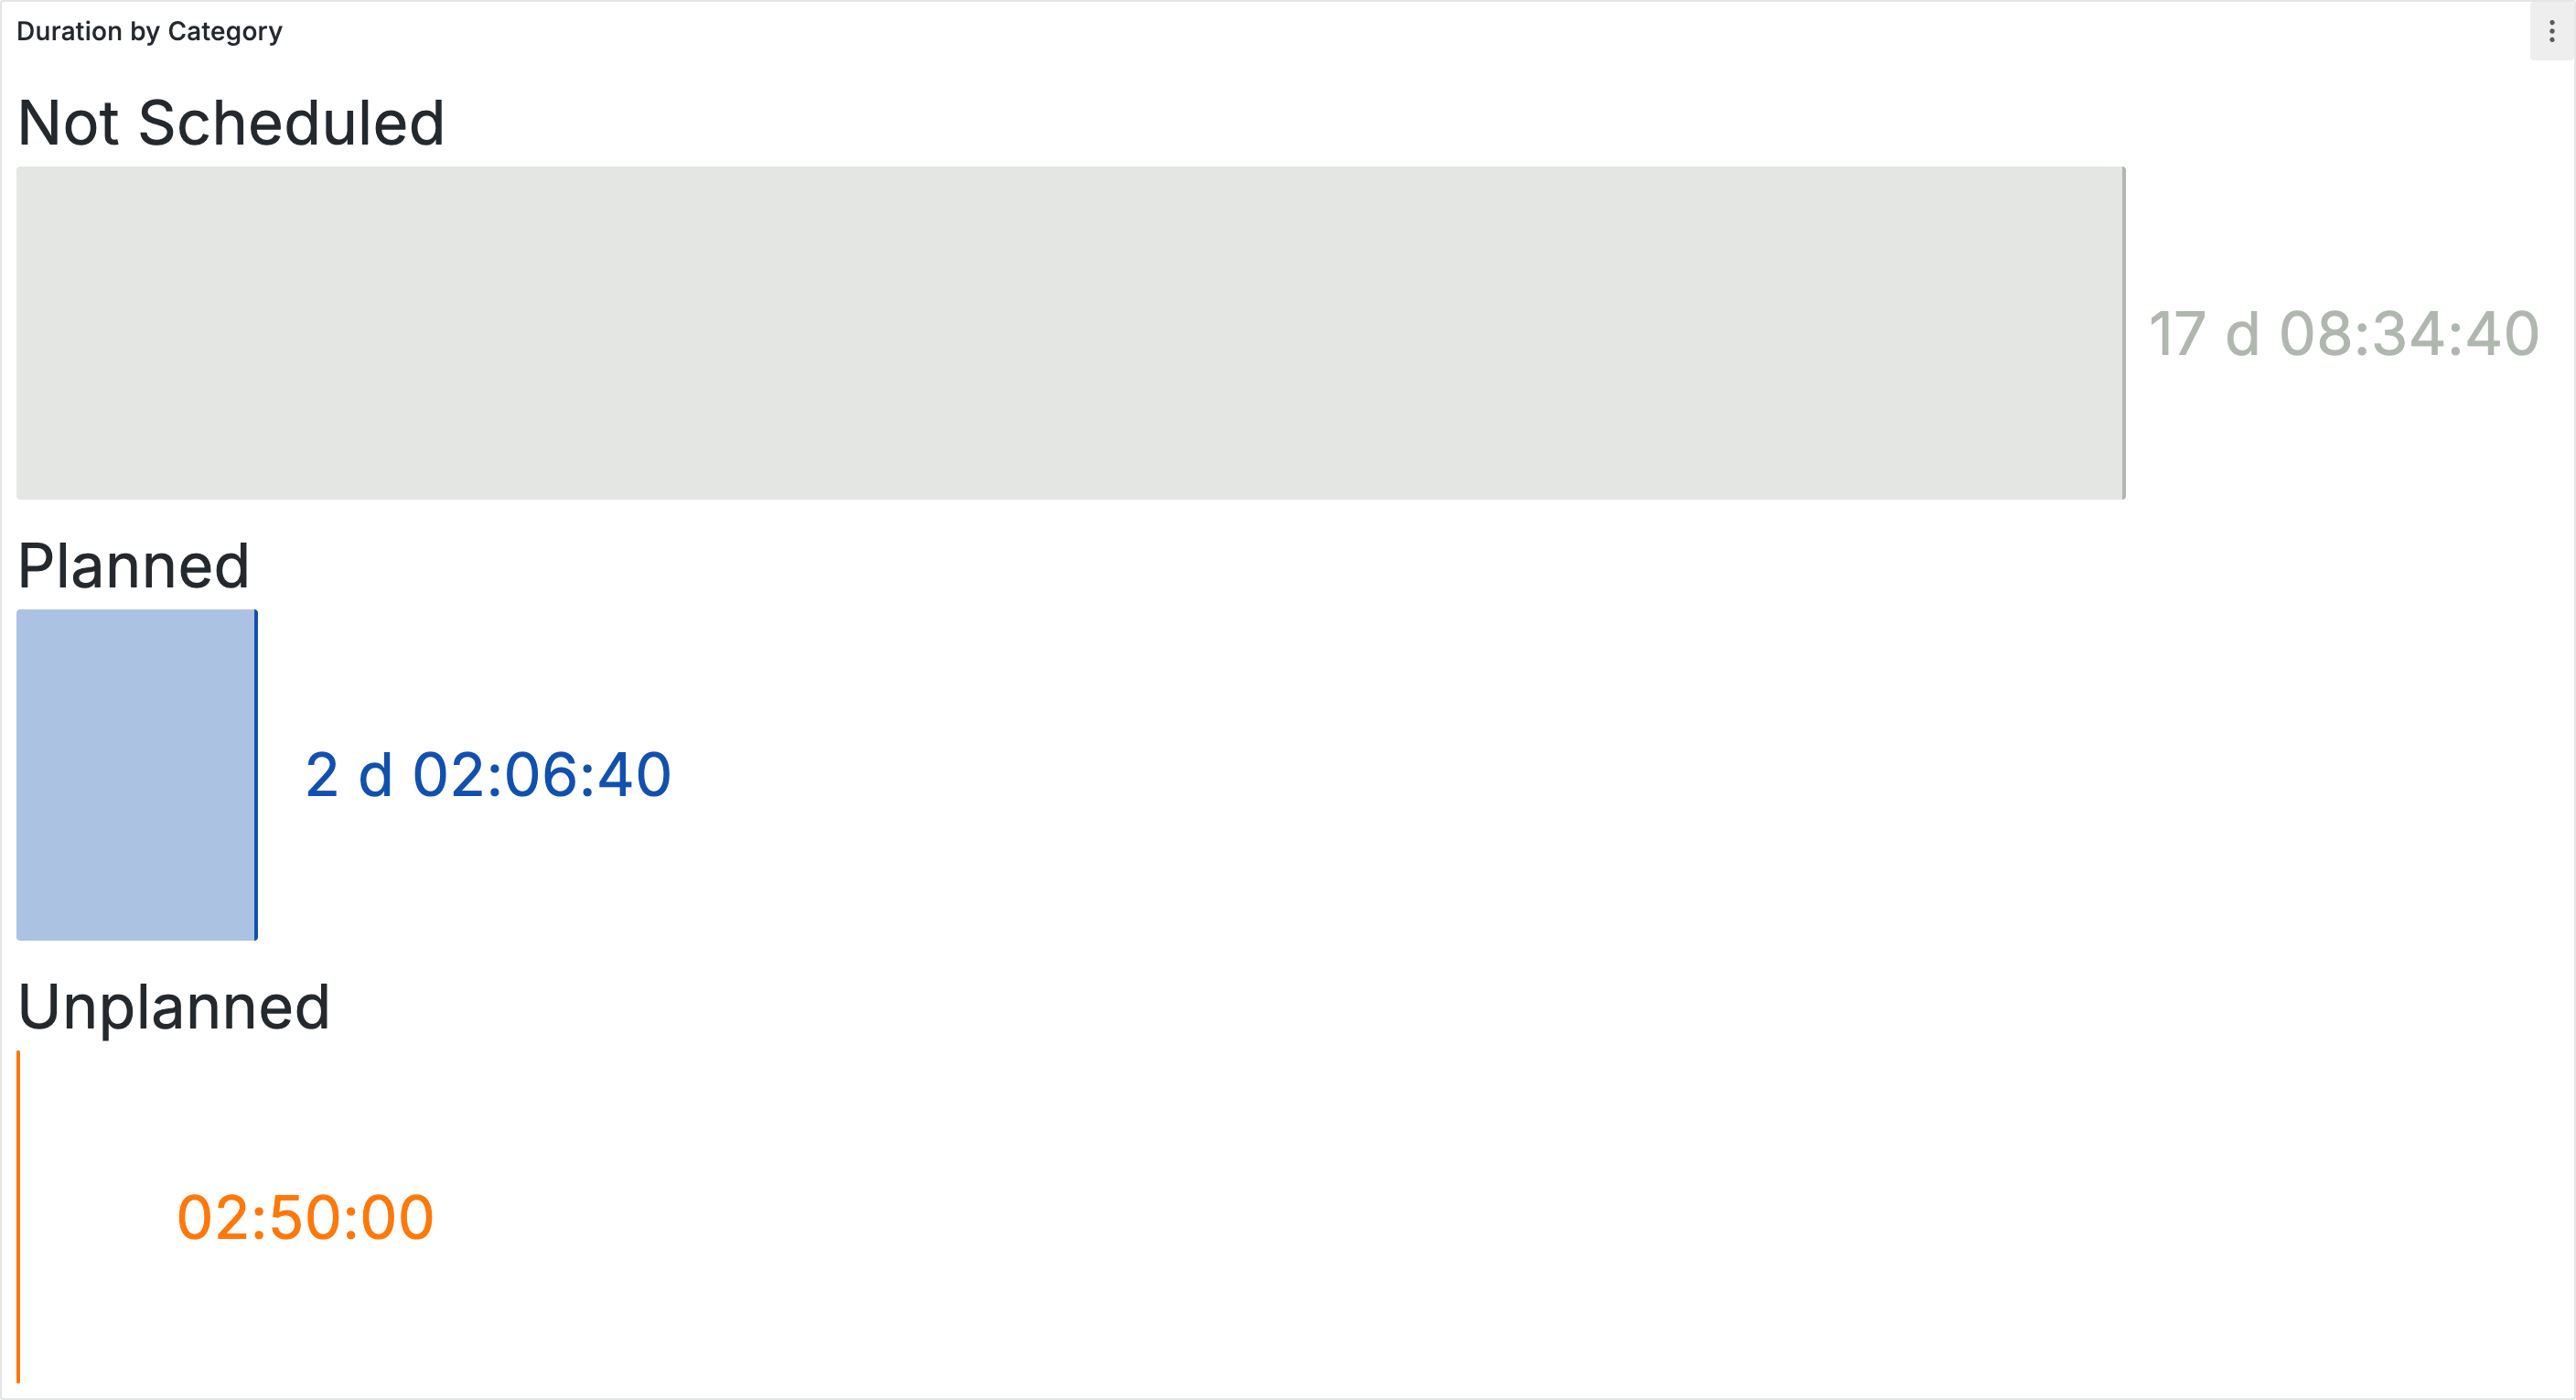
## Bar Gauge nach Kategorie
Zeige die Dauer pro Kategorie als horizontale Balken:
| Einstellung | Wert |
| ------------- | --------------------- |
| Visualization | Bar Gauge |
| Orientation | Horizontal |
| Display mode | Basic |
| Unit | Duration (d hh:mm:ss) |
Verwende die gleiche Query und Transformationen wie beim Kreisdiagramm.
***
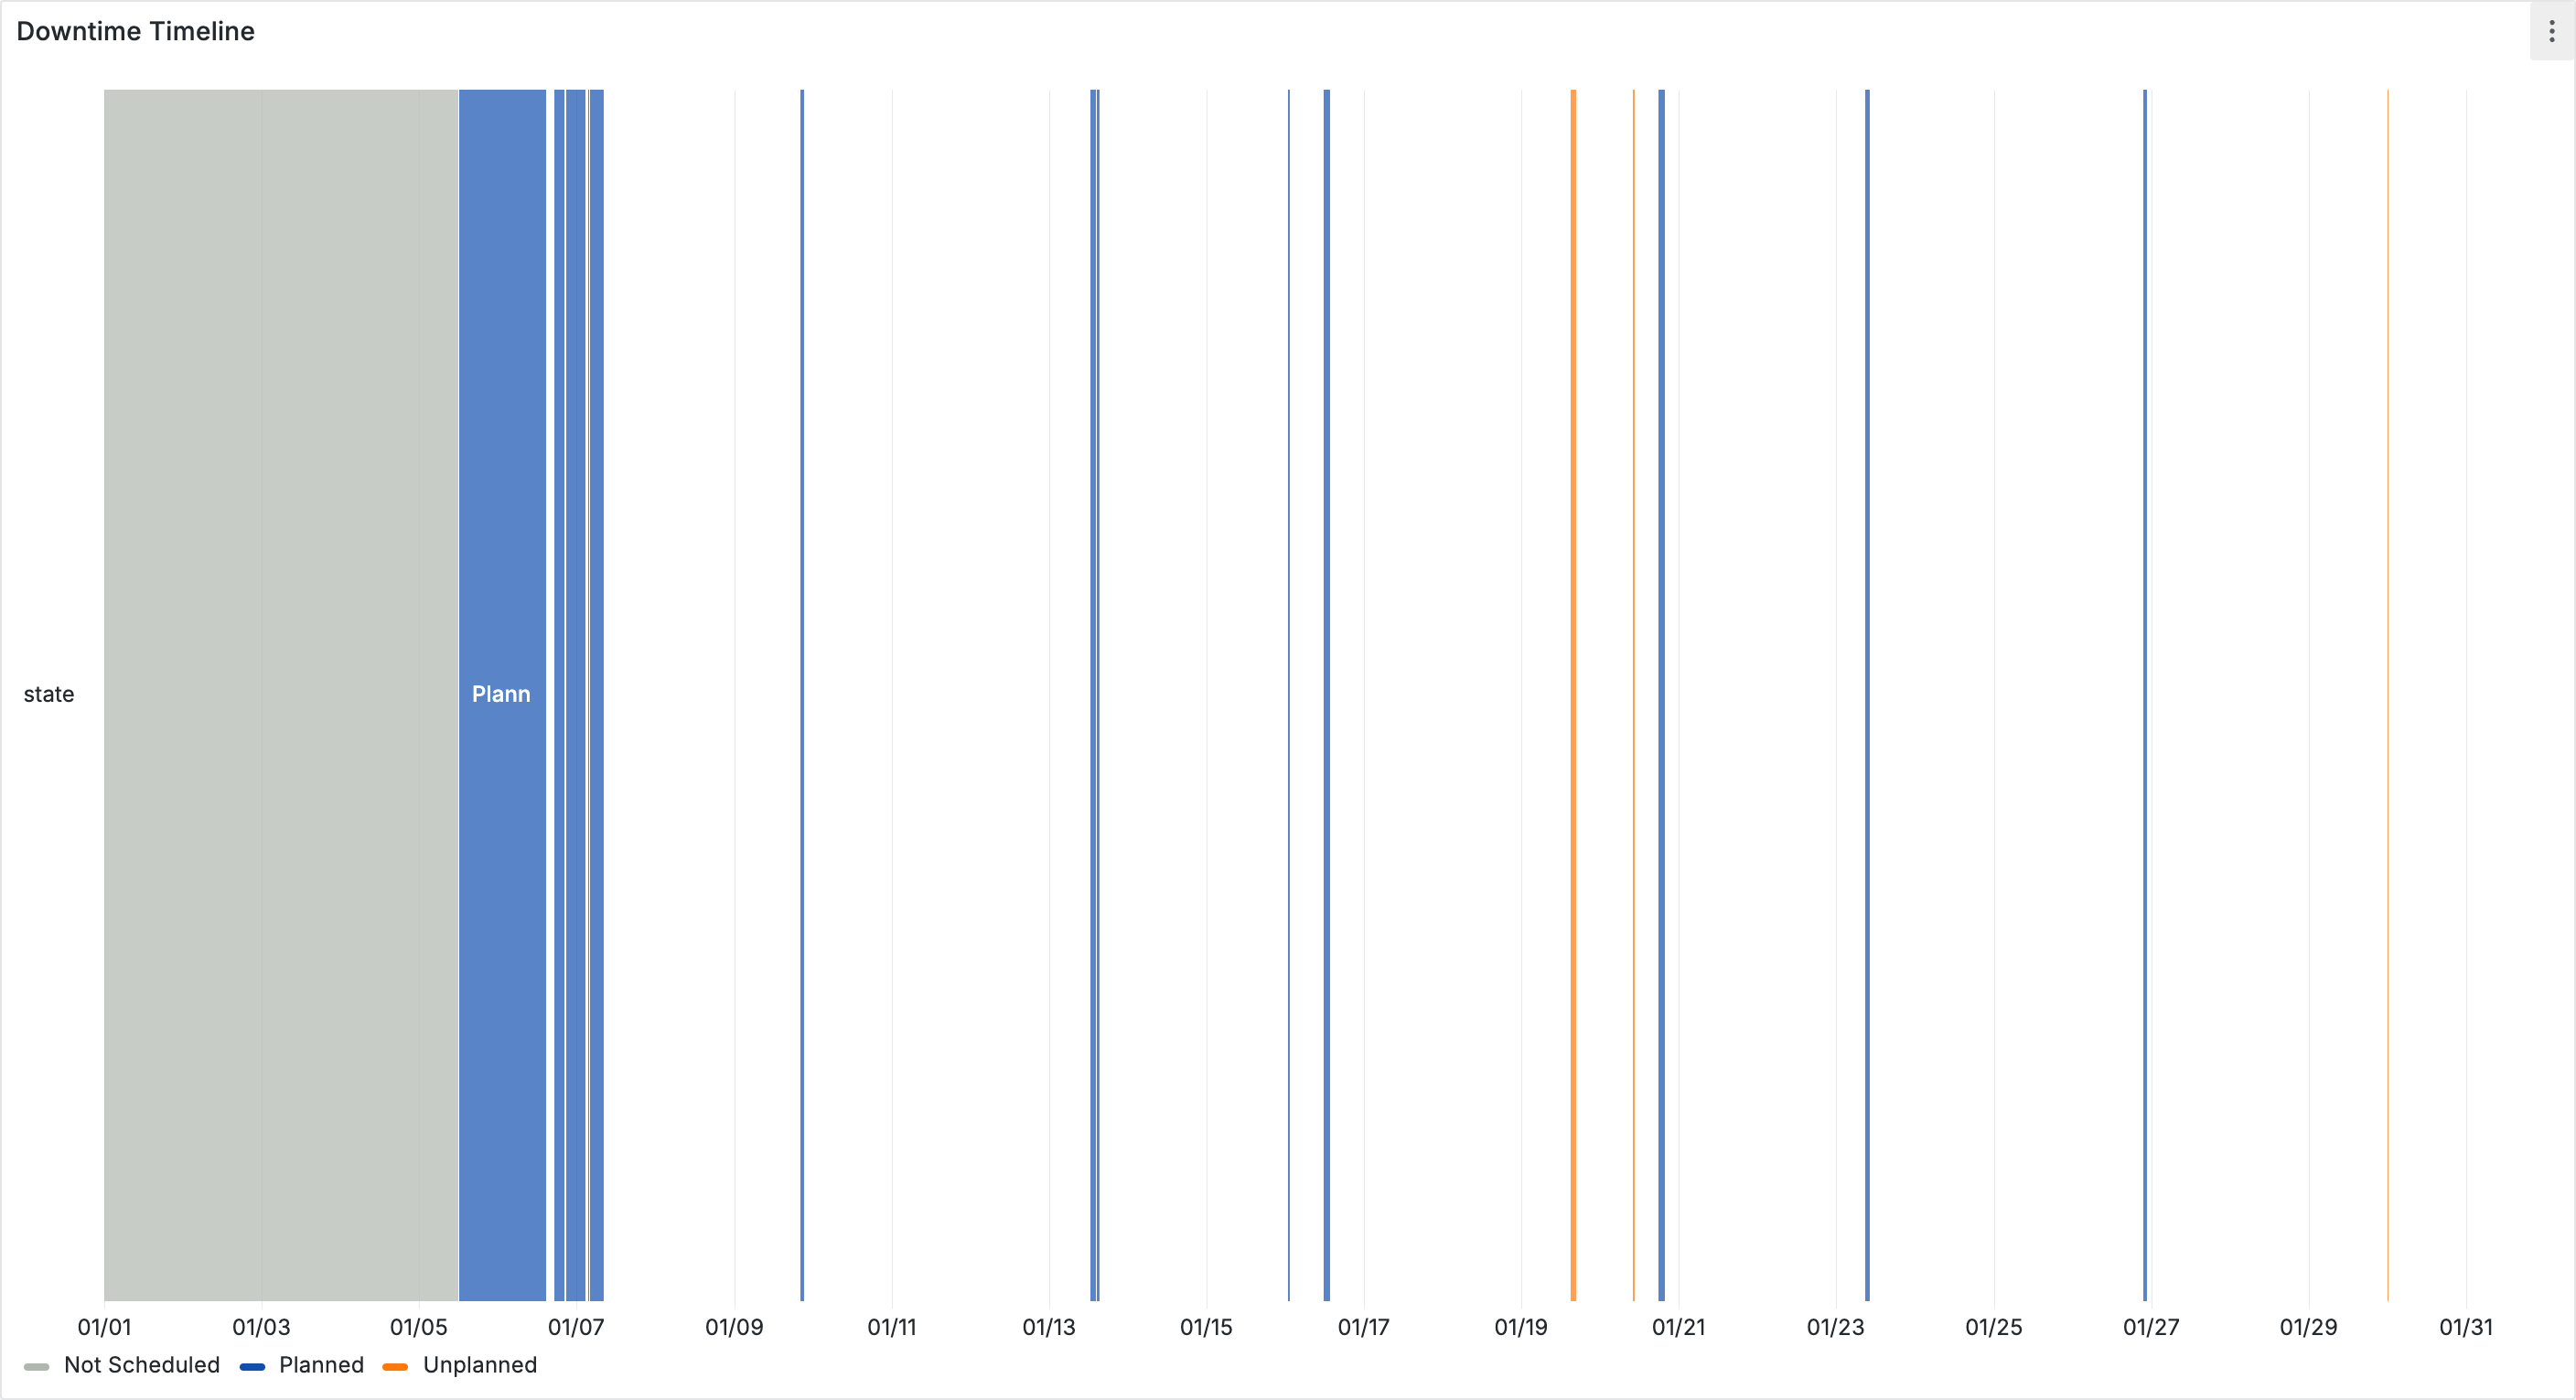
## State Timeline
Zeige, wann Stillstände im Zeitverlauf aufgetreten sind:
| Einstellung | Wert |
| ------------- | -------------- |
| Visualization | State timeline |
| Merge values | On |
Verwende dieselben Value Mappings wie beim Kreisdiagramm, damit die Kategorien farblich konsistent sind.
***
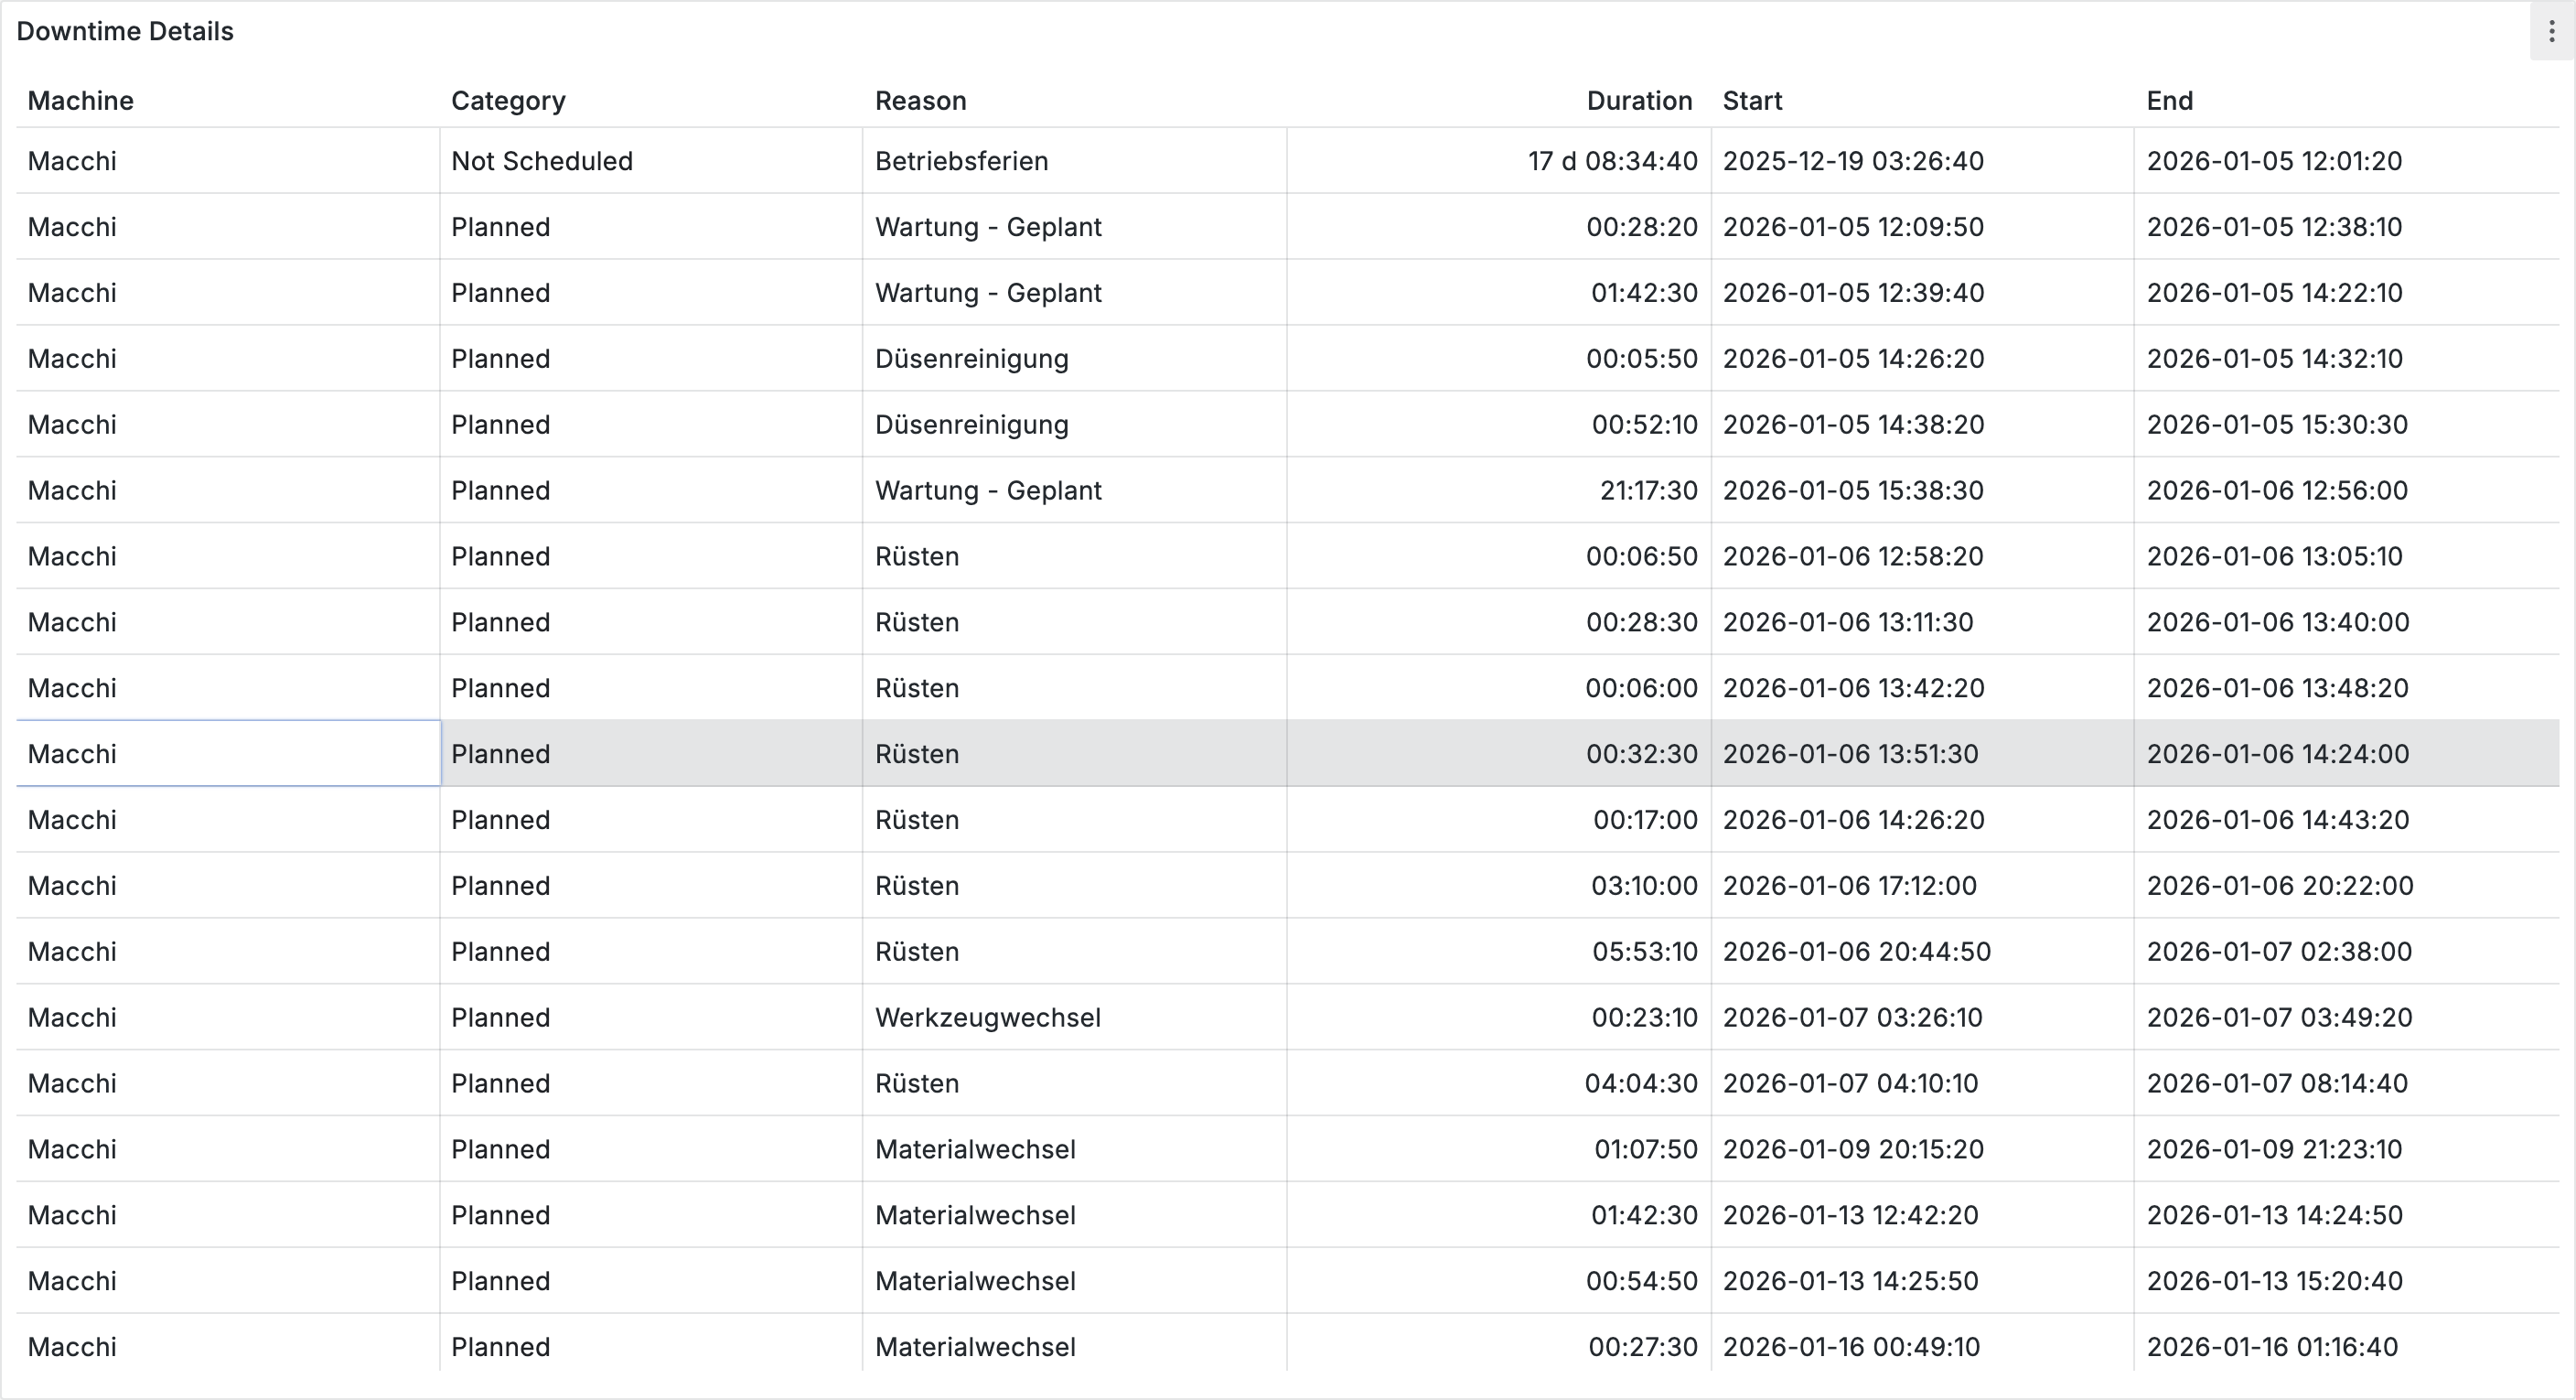
## Detailtabelle
Zeige einzelne Stillstandsereignisse mit allen Details:
| Spalte | Typ | Besonderheit |
| -------- | --------- | -------------- |
| start | Timestamp | dateTimeAsIso |
| end | Timestamp | dateTimeAsIso |
| duration | Number | Unit: dtdhms |
| category | String | Value Mappings |
| reason | String | - |
***
## Tipps
* **Stillstandskategorien**: `PLANNED` (geplante Wartung, Rüsten), `UNPLANNED` (manuell gemeldet), `NOT_SCHEDULED` (keine Produktion eingeplant). Verwende konsistente Farben in allen Panels.
* **Laufende Stillstände**: Ersetze `null`-Endzeiten mit `$now()` in JSONata, damit die Dauerberechnung funktioniert.
* **Leere Daten**: Prüfe den Zeitbereich. Stillstände sind nur für Zeiträume verfügbar, in denen die Maschine aktiv war.
* **Pareto-Analyse**: Filtere auf `UNPLANNED`, gruppiere nach `reason` und sortiere absteigend nach `duration`, um die häufigsten Stillstandsgründe zu identifizieren.
***
## Nächste Schritte
* [**Shopfloor-Monitoring**](https://docs.enlyze.com/integrations/grafana/production-dashboards/01-shopfloor-monitoring) - Dashboards für große Bildschirme und Mobilgeräte erstellen
---
# Agent Instructions: Querying This Documentation
If you need additional information that is not directly available in this page, you can query the documentation dynamically by asking a question.
Perform an HTTP GET request on the current page URL with the `ask` query parameter:
```
GET https://docs.enlyze.com/integrations/grafana/production-dashboards/06-downtime-reporting.md?ask=
```
The question should be specific, self-contained, and written in natural language.
The response will contain a direct answer to the question and relevant excerpts and sources from the documentation.
Use this mechanism when the answer is not explicitly present in the current page, you need clarification or additional context, or you want to retrieve related documentation sections.