Mapping UUIDs to Display Names
In ENLYZE, every data entity—such as Sites, Machines, Products, Downtimes, etc.—has a unique identifier (UUID). These UUIDs are essential for referencing elements across tables but can make the data model less readable.
When analyzing data in Power BI, it is often more convenient to use display names instead of UUIDs. This guide explains different methods to map UUIDs to their corresponding display names. Depending on where the mapping takes place, you may need to use DAX formulas or Power Query transformations.
There are two common scenarios where mapping UUIDs to display names is useful:
Adding a new column within a table, such as including machine names in the
Production Runstable.Renaming columns after querying time-series data for machine variables.
Adding a New Column with Display Names
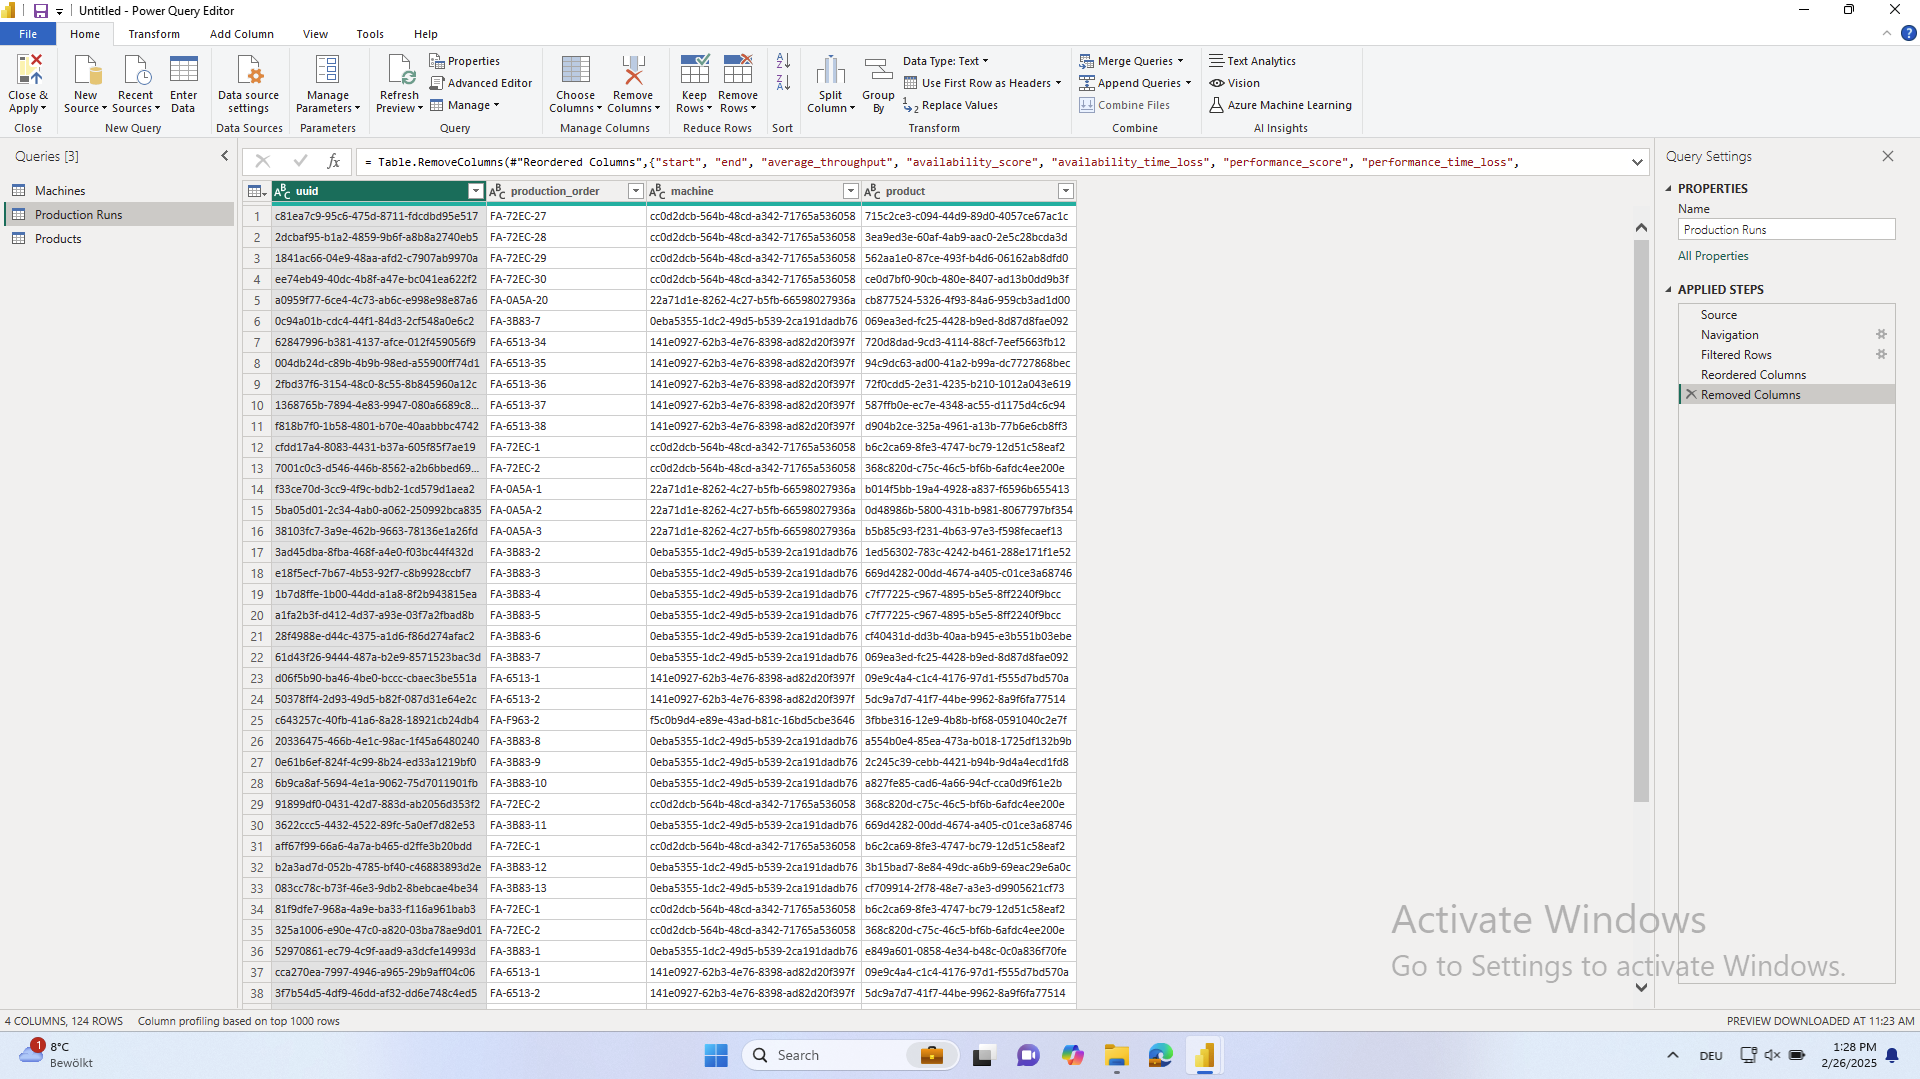
Let’s consider the Production Runs table, which stores information about:
Which machine an order was running on.
Which product was being produced.

Since the Production Runs table stores machine and product references as UUIDs, we want to replace them with readable names using the Machines and Products tables.
Method 1: Using DAX with LOOKUPVALUE
In this method, we use DAX (Data Analysis Expressions) to look up and retrieve display names.
To add the machine name, follow these steps:
Open Power BI and go to the Table View.
Select the Production Runs table.
Under Table Tools tab, click New Column.
Enter the following formula in the column definition bar:
How It Works
LOOKUPVALUEsearches for the machine name in the Machines table,It finds the row where
Machines[uuid]matchesProduction Runs[machine],It returns the corresponding machine name.
Now, the Production Runs table will have a machine_name column with readable names instead of UUIDs.
Method 2: Using a Merge Operation in Power Query Editor
This method uses Power Query to merge data tables and replace UUIDs with display names.
To add the product name, follow these steps:
Open Power Query Editor (Transform Data in Power BI).
Select the
Production Runstable.Under Combine, click Merge Queries (Merge Queries as New if you want a new table).
In the pop-up window:
The
Production Runstable will already be selected.Select
Productsas the second table.Choose
Product UUIDin both tables as the matching key.Under Join Kind, select Left Outer to keep all records from
Production Runs.A message will appear showing how many rows found a match. Ideally, all rows should match.
Click OK.
Expand the newly created column by clicking the expand button on the right of the column name.
Select Product Name and click OK.
Now, the Production Runs table will include a product_name column with readable product names instead of UUIDs.
Both methods allow you to replace UUIDs with display names, improving readability and usability in Power BI:
Use DAX (
LOOKUPVALUE) if you prefer calculations inside your Power BI model.Use Power Query (
Merge Queries) if you want to transform the data before loading it into Power BI.
Renaming Columns in Time Series Data using Power Query
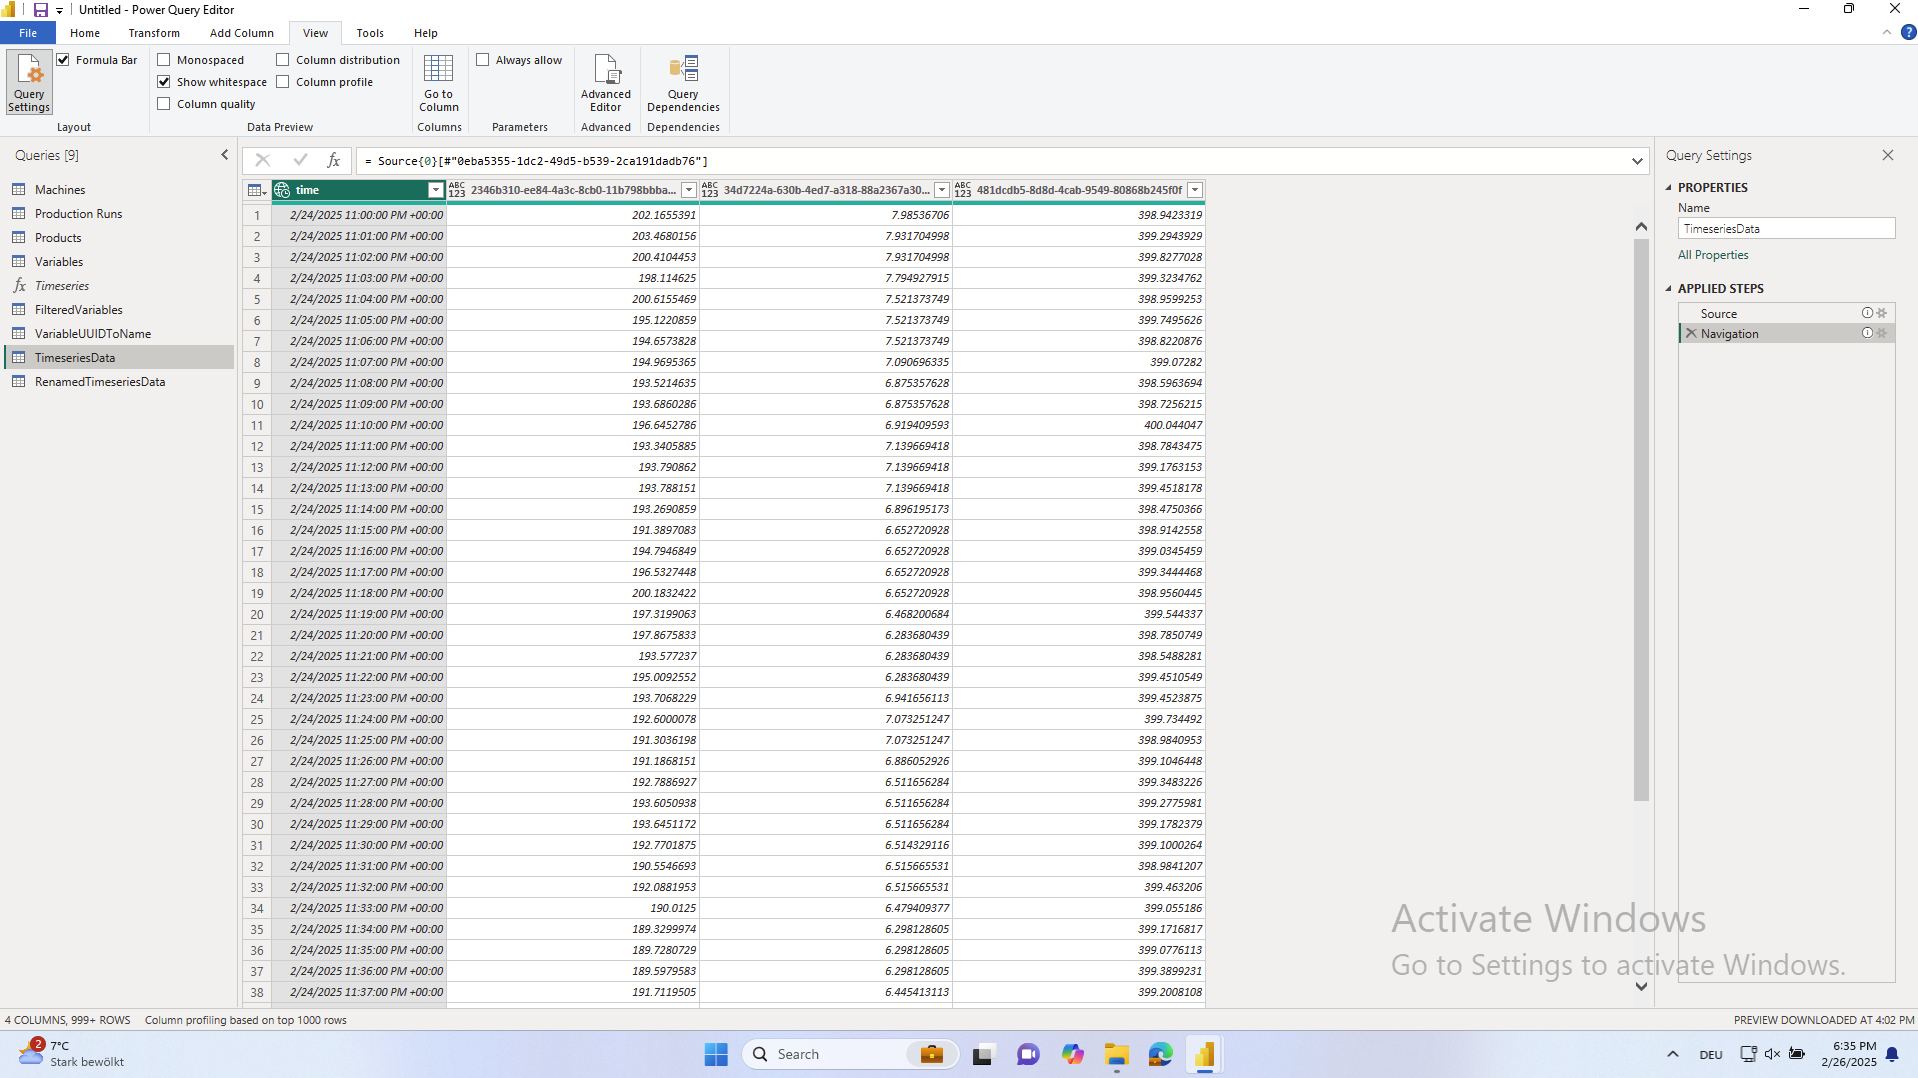
When using the Timeseries function from the connector, the column names don’t show variable names but variable UUIDs. Many times, It is convenient to rename those columns and use the machine and variable display names to improve readability of the data.

We have created a function that will do this name mapping automatically after querying the time series data.
The Mapping Function
How it works
1. Fetch Time-Series Data
The function starts by calling the Timeseries function from the ENLYZE connector with:
FilteredVariables– A filtered version of theVariablestable with the variables that should be used in the query.A start and end time – Currently set from February 25, 2025, to February 26, 2025.
A sampling interval of 1 minute.
An aggregation method of average ("avg").
All these inputs can be modified as needed
2. Rename Machine UUIDs to Machine Names
Machine UUIDs in the result are mapped to their corresponding machine names.
The function retrieves the mapping from the
Machinestable (uuid→name).Machine column names are updated accordingly.
3. Rename Variable UUIDs
Inside each machine column, variable UUIDs are replaced with their display names.
The function extracts variable mappings from
FilteredVariables(uuid→display_name).
How to use it
To use the function, you will need:
The
Machinestable from the ENLYZE ConnectorThe
Timeseriesfunction from the ENLYZE ConnectorA table called
FilteredVariables, which should be a copy of theVariablestables from the ENLYZE Connector with a filter on the variables needed for the time series query
To use the function
Go to New Source > Blank Query to add a new empty query
Open the Advance Query editor under View > Advanced
Copy and paste the function code
Adapt the inputs of the
Timeseriesfunction to your necessitiesClick on Done
After running the function, the final table will have machine and variable names instead of UUIDs in the column names
Last updated